
Table of Contents
National Multidimensional Poverty Index: Relevance
- GS 2: Issues relating to poverty and hunger.
National Multidimensional Poverty Index: Context
- Recently, National Multidimensional Poverty Index published by NITI Aayog in collaboration from Oxford Poverty and Human Development Initiative (OPHI) and the United Nations Development Programme (UNDP).
National MPI: Key points
- This baseline report of India’s first ever national MPI measure is based on the National Family Health Survey-4 (NFHS-4) 2015-16.
- The national MPI measure has been constructed by utilising twelve key components which cover areas such as health and nutrition, education and standard of living.
- The Alkire-Foster Methodology: The AF methodology is a general framework for measuring multidimensional poverty that identifies people as poor or not poor based on a dual-cutoff counting method. National MPI uses this methodology.
- The national MPI model retains the ten indicators of the UN Multidimensional Poverty Index model.
- India’s MPI has three equally weighted dimensions – health, education, and standard of living – which are represented by twelve indicators.
- National Multidimensional Poverty Index: Baseline Report based on NFHS-4 (2015-16) is a contribution towards measuring progress towards target 1.2 of the Sustainable Development Goals (SDGs) which aims at reducing “at least by half the proportion of men, women and children of all ages living in poverty in all its dimensions.
- National Multidimensional Poverty Index report presents an in-depth analysis of the headcount ratio and intensity of multidimensional poverty at the national, State/UT, and district levels.

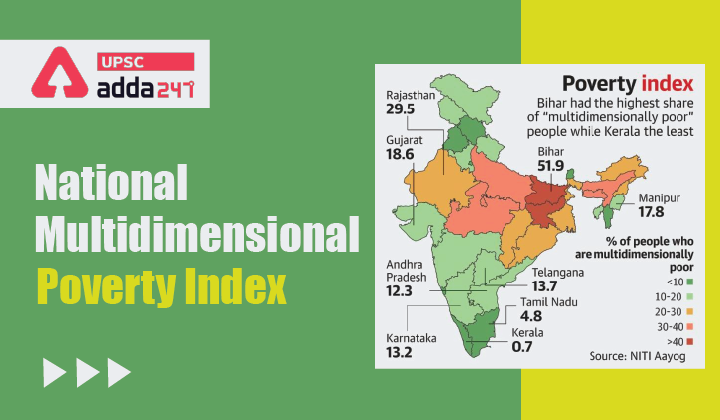
National Multidimensional Poverty Index: Key findings
- The report finds that Bihar has the highest proportion of people who are multidimensionally poor.
- More than half of the people (52%) in Bihar are categorised as multidimensionally poor.
- Bihar is followed by Jharkhand and Uttar Pradesh.
- Bihar also has the highest number of malnourished people followed by Jharkhand, Madhya Pradesh, Uttar Pradesh, and Chhattisgarh.
- Kerala, Goa, and Sikkim have the lowest percentage of population being multidimensionally poor.
- Poorest UTs: Dadra and Nagar Haveli, Jammu & Kashmir, and Ladakh, Daman & Diu and Chandigarh.
- The proportion of poor in Puducherry at 1.72 per cent is the lowest among the Union Territories.

Poverty measurement in India
- Earlier, the method has been to specify a minimum income (or expenditure) required to purchase a basket of goods and services to meet basic needs.
- This conventional method required defining a poverty line first, which the C Rangarajan committee had estimated in 2014 to be Rs 972 a month per person in rural areas and Rs 1,407 a month per person in urban areas, at 2011-12 prices.
Recent poverty related news:


 TSPSC Group 1 Question Paper 2024, Downl...
 TSPSC Group 1 Answer key 2024 Out, Downl...
 UPSC Prelims 2024 Question Paper, Downlo...