
Table of Contents
Introduction
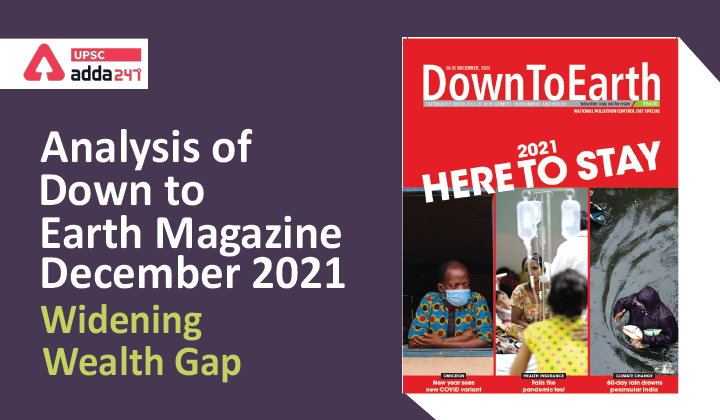
- “World Inequality Report 2022” Released on December 7 by The World Inequality Lab, a global research initiative.
- It suggests that the world’s richest 1 per cent now control more than one-third of the global wealth generated since the 1990s.
- In fact, the number of billionaires rose to new records in 2020—the year of the pandemic.
- According to an estimate, the income of the poorest half of the world is half of what his or her ancestor in the same population group would have had, way back in 1820.
- Thus the prevailing trend shows that the rich are getting richer and the poor are getting poorer.
Key Findings on India in World Inequality Report 2022
• The latest World Inequality Report flags India as a poor and very unequal country, with the top 10% holding 57% of national income in 2021, and the bottom 50% holding just 13%. Breaking down the key findings.
• India stands out as a “poor and very unequal country, with an affluent elite”, where the top 10% holds 57% of the total national income, including 22% held by the top 1%, while the bottom 50% holds just 13% in 2021, according to the World Inequality Report 2022.
• The report also flags a drop in global income during 2020, with about half the dip in rich countries, and half in low-income and emerging countries. It attributes this primarily to the impact of “South and Southeast Asia, and more precisely” India.
• It says India’s middle class is relatively poor with an average wealth of Rs 7,23,930, or 29.5% of the total national income, compared with the top 10% and 1% who own 65% (Rs 63,54,070) and 33% (Rs 3,24,49,360), respectively.
• The average annual national income of the Indian adult population is Rs 2,04,200 in 2021. The bottom 50% earned Rs 53,610, while the top 10% earned over 20 times more (Rs 11,66,520), the report states. The average household wealth is Rs 9,83,010, of which the bottom 50% owns Rs 66,280, a mere 6%.
Imperialism vs Democracy
- According to the report, there has been unbridled inequality in both income and wealth with the rise of democracy, economic liberalisation and the free market.
- It is following a similar trend as seen during the starkly different era of western imperialism; in many countries, it is even worse than at that time.
- During both 1820 and 2020, the top 10 per cent of income-earners accounted for 50-60 per cent of total income, while the bottom 50 per cent has consistently recorded 5-15 per cent.
- This inequality does not question democracy, but rather the choices we make under democracy.
Huge imbalance between wealth and income levels
- Wealth is the capital or assets that an individual or country holds now and that the next generation will inherit. Income, on the other hand, is the flow of money for an activity. The level of wealth held often decides the capacity to increase the level of income earned.
- Global wealth was around €510 trillion (US $575.5 trillion) in 2020, about 600 per cent of the global income level. This ratio was just 450 per cent in the 1990s.
- In the case of India, one household in India, on average, has wealth worth R983,010. But the general wealth held by the bottom 50 per cent is “almost nothing” at R66,280, just 6 per cent of the Indian average.
- Per capita annual earning of the bottom 50 per cent of the population of India is R53,610, while a person belonging to the top 10 per cent earns 20 times this amount. Similarly, the top 1 per cent of the country holds more than one-fifth of the national income while the bottom half accounts for just 13 per cent of the same
- So, India’s wealth distribution also signals how fast inequality is growing.
Why rich growing richer and the poor poorer?
- People accumulate wealth across generations through inheritance. It has a snowball effect, wherein successive generations will gain more, but in their concentrated section.
- More capital incentivises banks to lend. This is why the rich section’s wealth grows faster.
- But it also creates a gap between people; in most countries, 50 per cent of the population does not own anything. This is the inequality on which future government interventions must focus.
- Public wealth has been declining for two reasons: first, governments have been privatising assets and natural resources at low costs.
- Second, governments contract debt to the private sector, making it richer. Without assets, governments have low resources to invest and mitigate climate change impacts, particularly in the energy sector. Currently, governments have more debts than assets. This calls for strategic management of the economy.


 TSPSC Group 1 Question Paper 2024, Downl...
 TSPSC Group 1 Answer key 2024 Out, Downl...
 UPSC Prelims 2024 Question Paper, Downlo...