
Standard Deviation: Standard Deviation is one of the most important concepts that find its application in Mathematics and Statistics. It is used in the analysis of the dataset. In the contemporary data-dominated world, it has become even more important. It gives us an idea of how much the data values are dispersed from the center point of any observation. It is generally denoted as SD for convenience. Standard deviation is closely related to the mean and variance values of the dataset. In this article, we will delve into various aspects of the standard deviation including its formula in different cases and some solved examples.
Standard Deviation
The average degree of variability in your dataset is represented by the standard deviation. It is also known as the root-mean square deviation and denoted as SD in short. It reveals the average deviation of each statistic from the mean. In general, values with a large standard deviation are spread out from the mean, and those with a low standard deviation are grouped together near to the mean. Because it uses the original units of measurement from the data set, it is a well-liked measure of variability. It is the most popular way to assess dispersion, which is based on all values. Therefore, even a small change in one value can modify the SD’s value. Although it is independent of origin, it is not independent of the scale. Additionally, it helps in solving some complex statistical issues.
Standard Deviation Definition
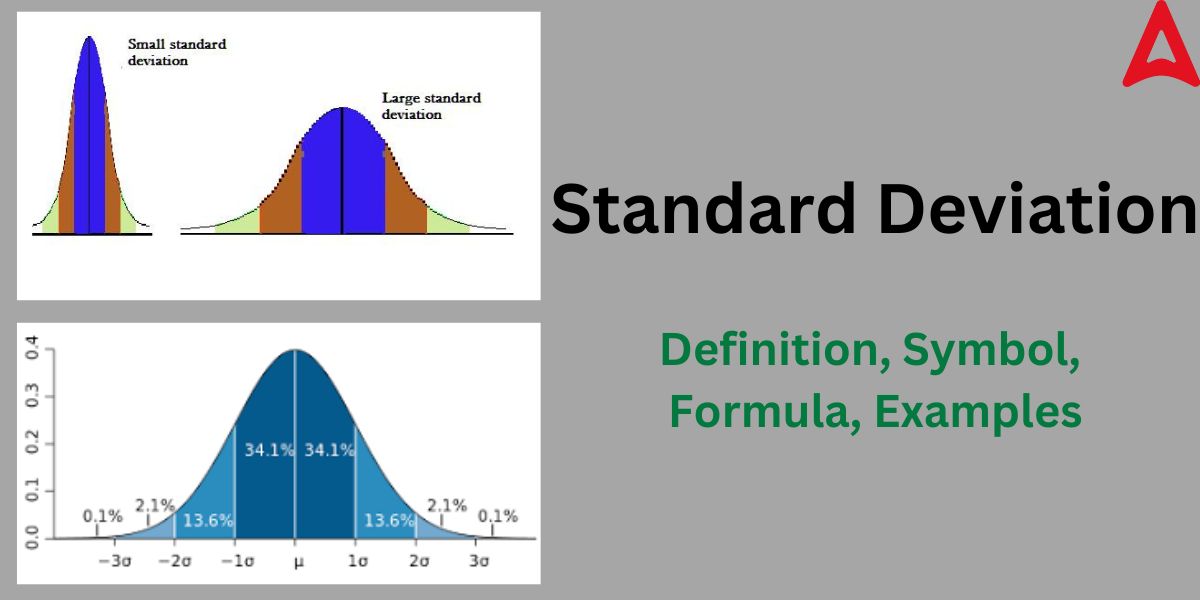
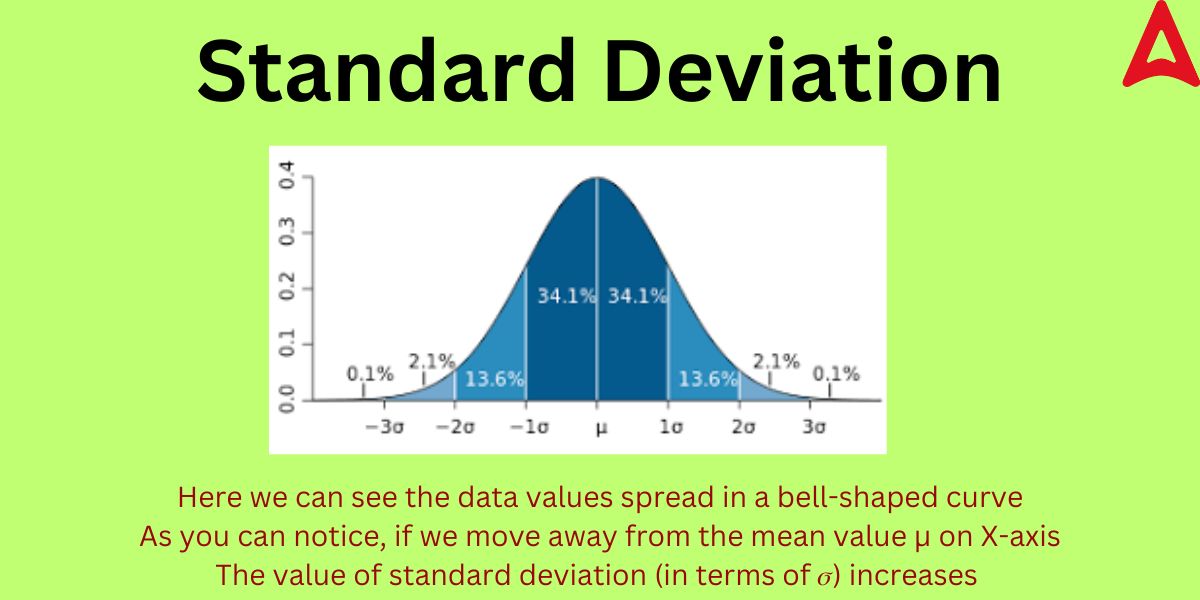
Standard Deviation is the degree of deviation of the data points from its mean or average value. It basically tells us how scattered the data points are in respect to its mean value. It is a metric for statistical data dispersion. The degree to which values in a distribution deviate from the distribution’s average is known as dispersion. It is a metric that reveals the degree of deviation from the mean (such as spread, and dispersion). A “typical” variation from the mean is shown by this statistical metric. The degree of variance or dispersion in a collection of data is measured statistically using this statistical tool. so, to sum up, we can say that it offers a means of expressing how much individual data points vary from the dataset’s mean (average). The following diagram will give you a better idea of this concept.
Standard Deviation Definition in Statistics
Standard Deviation is an important tool of statistical interpretation. In statistics, it gives the measure of the values in a given sample. It is a statistical measure that summarizes how far away from the mean each observation is. A dataset’s dispersion from its mean is measured by this statistical tool. It is determined as the variance’s square root.
In the financial industry, it is frequently employed as a gauge of an asset’s relative riskiness. A volatile stock has a high standard deviation, whereas a solid blue-chip stock often has a low value of SD. Its statistical aspect helps in making very calculated decisions in different fields.
Standard Deviation Symbol
This statistical tool is represented using a symbol for convenience purpose. This symbol is recognized as the formal symbol of the SD. The symbol is denoted by the Greek symbol σ (sigma). This symbol removes the ambiguity in representation of this statistical tool. It is important to memorize this symbol from the examination point of view as the questions may be asked using the symbol without mentioning its name.
Standard Deviation Formula
After learning all the basic facts and symbols related to the SD, let us now find its general formula. Suppose we have been given with data points X1, X2, X3, X4, …..Xn in a dataset. Let the mean of the data points be A. Then the square of the difference of each individual data points from the mean value will give the degree of randomness of the data.
The sum of squares of departures from the mean, however, doesn’t appear to be an accurate indicator of dispersion. But the mean value of this sum of squares will give a clear idea of how scattered the data points are. The observations Xi are likely close to the mean A if the average of the squared differences from the mean is low. This dispersion is at a lower level. A higher degree of dispersion of the observations from the mean A is indicated if this total is considerable. The average of the summation of the squares of departures from the mean is variance. We can obtain the standard deviation from variance by taking its positive square root value. The mathematical expression for the same is given below.
The Standard Deviation formula is given by:
σ = √(1/n)
²where, σ = standard deviation
μ = mean value of the observation
n = total number of data points
Xi = ith data point in the given dataset
How to Interpret Standard Deviation Results
We can find out different characteristics of a given data sample using the results of SD. IT is an important tool in confirming various facts of a dataset. The value of the root-mean square deviation tells us about how closely the data points are in respect with the mean value. It also helps us to predict the shape of the graph. A low SD value means that the data are closely grouped around the mean, whereas a high SD value means that the data are more widely dispersed. Low SD value signifies that the data values are much closer and shows little variation and vice versa. This can be understood through the diagram given below.
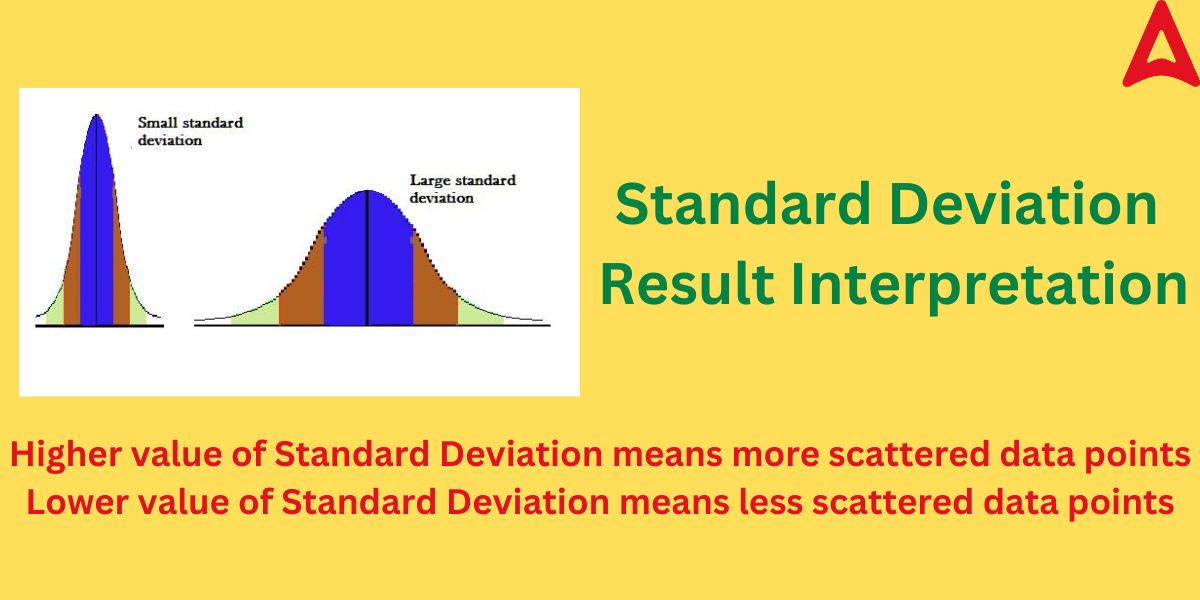
As one can observe from the above diagram that high SD value gives a more bell-shaped curve with less steepness due to wide scattering of data points while the lower values of SD means a more steeper curve with data points close to the mean value.
How to Calculate Standard Deviation from Mean
We can calculate the SD value from the mean value of the given dataset by using the mean value for grouped, sample, and ungrouped data. The formula for the same is given below:
For Ungrouped Data
σ = √(1/n)
²
σ = standard deviation
μ = mean of the observation
Xi = ith data point in the given dataset
For Grouped Data
σ = √(1/n)
²
= n = total number of observations
μ = mean of the observation
Xi = ith data point in the given dataset
For Sample Data
σ = √(1/n-1)
²
σ = standard deviation
μ = mean of the observation
Xi = ith data point in the given dataset
n = total number of selected observations
How to Calculate Standard Deviation from Variance
Just like the standard deviation, variance is a measure of dispersion of the data points from the mean value. Variance basically tells us about how close the data points are to the mean and each other. There is a very strong relation between these two statistical tools. we can calculate the value of SD through the value of variance. The square root of the variance is used to calculate the standard deviation, a statistic that expresses how widely distributed a dataset is in relation to its mean. By calculating the deviation of each data point from the mean, the standard deviation may be determined as the square root of variance. Mathematically, the relation can be expresses as:
SD = √Var
where SD =standard deviation
Var = variance
Standard Deviation Examples
Some of the examples on this topic is given below. These solved examples will help students understand this concept in a better way.
Example 1: The garden contains 50 plants. The following plants were chosen at random, and their heights in cm were noted: 51, 38, 79, 46, 57. Determine their heights’ standard deviation.
Solution: As given in the question, number of chosen plants (n) = 5
mean (μ) of the chosen plants = (51 + 38 + 79 + 46 + 57)/5
μ = 54.2
Now finding the summation of (Xi – X)², for i = 1 to 5
(51 – 54.2)² + (38 – 54.2)² + (79 – 54.2)² + (46 – 54.2)² + (57 – 54.2)²
using the SD formula for sample data, we get
SD = √(1/n-1)
²
SD = √[(51 – 54.2)² + (38 – 54.2)² + (79 – 54.2)² + (46 – 54.2)² + (57 – 54.2)²]/4
SD = 15.5
Example 2: Determine the Standard Deviation of the first five natural numbers.
Solution: First five natural numbers = 1, 2, 3, 4, 5
mean (A) of first five natural numbers = (1 + 2 + 3 + 4 + 5)/5
A = 3
∑(Xi – X)² = (1-3)² + (2-3)² + (3-3)² + (4 – 3)² + (5 – 3)²
∑(Xi – X)² = 10
Using the SD formula (σ) = √(1/n)
²
SD = √10/5
SD = √2
Example 3: What will the SD of a dataset if its variance is 16?
Solution: As we know, SD = √variance
so, SD = √16
Hence, SD = 4


 CLAT 2027 Preparation: Complete Study Pl...
 Best CLAT Online Course 2027: Why Adda24...
 Best Strategy to Attempt the CUET Exam f...