
How to make a pie chart
How to make Pie Chart with an Example for Excel process is described here. A pie chart is a spherical statistical visual that is split into slices to depict numerical proportion. Each slice’s arc length in a pie chart is proportionate to the amount it depicts. While it gets its name from its similarity to a sliced pie, there are other ways to serve it. William Playfair’s Statistical Breviary of 1801 is credited with creating the first documented pie chart.
In the corporate world and the media, pie charts are commonly used. However, they have been criticised, and many experts advise against using them because research has shown that comparing different areas of a pie chart or data across different pie charts is difficult. In most circumstances, other plots such as the bar chart, box plot, dot plot, and so on can be used instead of pie charts.
How to make Pie charts?
William Playfair’s Statistical Breviary of 1801, which contains two such graphs, is widely regarded as the first known pie chart. Playfair displayed a diagram that included a succession of pie charts. Before 1789, one of the charts illustrated the proportions of the Turkish Empire in Asia, Europe, and Africa. At first, this invention was not widely employed.
Pie charts, according to Playfair, needed a third dimension to give more information.
Although Florence Nightingale did not originate the pie chart, she improved it to make it more readable, which led to its widespread use, which continues to this day. Indeed, Nightingale rearranged the pie chart such that the length of the wedges could be varied rather than their width. As a result, the graph resembled a cock’s comb. Due to the obscurity and lack of practicality of Playfair’s idea, she was later considered to have produced it. The Nightingale rose diagram, which is equivalent to a modern circular histogram, was published in Notes on Matters Affecting the Health, Efficiency, and Hospital Administration of the British Army and sent to Queen Victoria in 1858 to illustrate seasonal sources of patient mortality in the military field hospital she managed.
Read About DNA
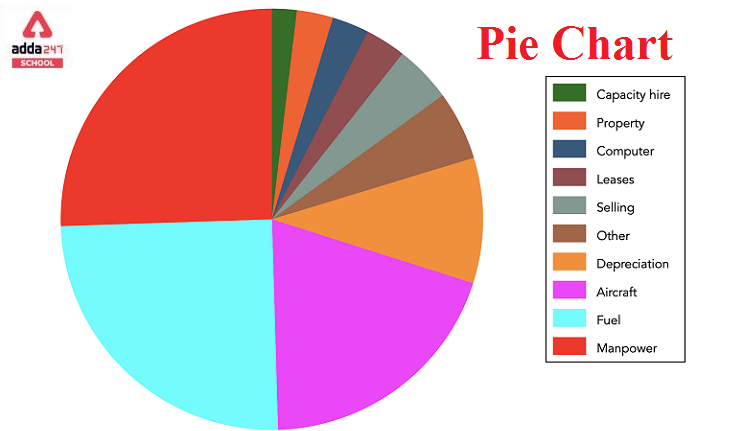
Pie Chart: How to make with example
To draw a pie chart on paper
- To obtain a total, first, enter your data into a table, then sum up all the values.
- To get a per cent, divide each value by the total and multiply by 100.
- Now it’s time to determine out how many degrees each “pie slice” should be (correctly called a sector).
- We conduct this computation because a whole circle contains 360 degrees.
- Make a circle with your pencil.
- Then, using your protractor, measure each sector’s degrees.
- Finish by giving each section a label or colour.
To make a pie chart in excel
Select the pie chart you wish to add to your slide by going to Insert. Then go to the Chart option. Click on Pie and select it. Replace the placeholder data with your own data in the spreadsheet that displays. See Data for pie charts for further information on how to arrange pie chart data. Close the spreadsheet when you’re done.


 CLAT 2027 Preparation: Complete Study Pl...
 Best CLAT Online Course 2027: Why Adda24...
 Best Strategy to Attempt the CUET Exam f...