

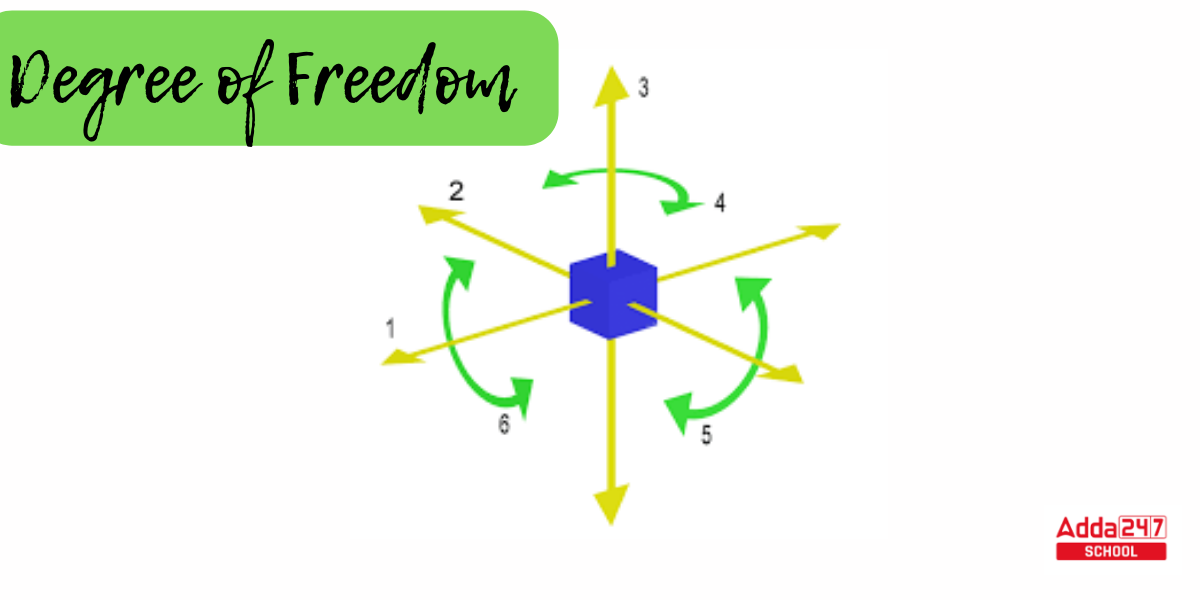
Degree of Freedom
Degree of Freedom: The number of possible values that a statistical study can estimate is expressed as the degree of freedom. It can also be thought of as the quantity of values that can change if you evaluate the parameters. The degree of freedom is obtained by dividing the number of items in the data sample by one. Degrees of freedom are frequently mentioned in statistical hypothesis testing, such as chi-square, T-test. You will learn the degree of freedom definition, types, examples, formulas, and how to calculate degrees of freedom for various studies such as linear regression, t-tests, and chi-square in this article.
Degree of Freedom Definition
The definition of degrees of freedom is a mathematical equation that is used primarily in statistics, but also in physics, engineering, and chemistry. Degrees of freedom are determined by the amount of data available and the number of parameters to be estimated. It displays the extent to which independent information is used to estimate a parameter. Degrees of freedom can be used to illustrate circumstances in business where management must make a decision that affects the result of another variable.
What is the Degree of Freedom in Statistics?
The first mention of degrees of freedom was made in the early 1800s by mathematician and astronomer Carl Friedrich Gauss. In statistics, the degree of freedom indicates the number of values in the final computation that can vary, implying that they can contribute to the validity of the conclusion. Although the number of observations and parameters to be measured is determined by the sample size or the number of observations and parameters to be measured. And in most calculations, the degree of freedom is equal to the sum of the observations minus the number of parameters. This suggests that there are degrees of freedom available for a bigger sample size.
Degree of Freedom Example in Statistics
Degree of freedom in statistical testing refers to the number of values in a sample that are able to vary without affecting the number of samples or observations. Let’s look at few examples to better grasp the Degree of Freedom.
Example 1 –
Assume you are waiting at a traffic signal when you receive a phone call inquiring as to which signal is active at the time. If the person understands which two of the three signs (red, orange, or green) are not turned on, he or she can determine the true signal. As a result, the degree of freedom is two.
Example 2 –
Consider the following data sample: five positive integers. The average of the five integer numbers must be six. If the first four numbers in the data set are 3, 8, 5, and 4, the fifth number needs to be 10. The degree of freedom is four since the first four numbers can be picked at random.
Example 3 –
Consider the following collection of information: Weights of 5 products in a 12KG package = (4, 2.5, 3.5, 1, 1)
The box contains five objects with four degrees of freedom. This means that only four items can have different weights since the weight of the fifth item must be equal to the difference between 12 KG and the total of the weights of the other four items. Thus, in the preceding example, four items can differ in terms of their weights.
How to calculate Degree of Freedom?
Assume we acquire the following random sample of observations. Assume we know the mean but not the value for a particular observation—the X in the table below. The mean is 6.9, based on ten values. Based on the equation for the mean, we know that the values must amount to 69.
| Values |
| 6 |
| 8 |
| 5 |
| 9 |
| 6 |
| 8 |
| 4 |
| 11 |
| 7 |
| X |
| Average – 6.9 |
| Sum – 69 |
We can deduce from elementary algebra (64 + X = 69) that X must equal 5.As you can see, the last number has no room for variation. It cannot be any other value, hence it is not an independent piece of information. Estimating the parameter, in this case the mean, limits the flexibility to fluctuate. The final number and the mean are completely interdependent. As a result, even though our sample size is 10, we only have 9 independent bits of information after estimating the mean.
That is the fundamental concept of Degree of Freedom in statistics. It may also be spoken of as the amount of independent data that can be used to estimate a parameter.
Degree of Freedom Formula
In his essay “The Probable Error of a Mean,” William Sealy Gosset, an English statistician, established the contemporary usage and understanding of the word.
In his writings, Gosset did not utilize the phrase “degrees of freedom.” He did describe the concept throughout the development of what became known as “Student’s T-distribution.”
- The formula for calculating the degree of freedom is –
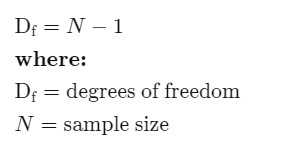
- Explanation – Consider the problem of choosing ten baseball players whose batting average must be at least.250. The sample size is the entire number of participants in our data collection, thus N = 10. In this example, 9 (10 – 1) baseball players are chosen at random, with the 10th baseball player having a specified batting average in order to conform to the .250 batting average limitation.
- In a chi-square test, the degrees of freedom formula for a table is (r-1) (c-1), where r is the total number of rows and c is the number of columns.
- Some degrees of freedom computations with many parameters or relationships employ the formula Df = N – P, where P denotes the number of various parameters or connections. In a 2-sample t-test, for example, N – 2 is employed because there are two parameters to be calculated.
Degree of Freedom Application
Although the Degree of freedom is ambiguous, it is extremely effective in practical world. Degree of freedom in statistics specify the form of the t-distribution used in t-tests to calculate the p-value.
- The t-distributions for various degrees of freedom will vary depending on the sample size. Understanding the significance of a chi-square statistic and the validity of the null hypothesis requires calculating degrees of freedom.
- Outside of statistics, degrees of freedom have conceptual uses. Consider a corporation making a purchasing decision for raw materials for its manufacturing process. Within this data set, the corporation has two items: the amount of raw materials to obtain and the overall cost of the raw materials.
The corporation can choose one of the two goods, but their choice will influence the end result of the other. In this case, it has one degree of freedom because it can only freely choose one of the two options. If the firm chooses on the amount of raw materials, it is unable to decide on the total amount spent. By limiting the overall amount to spend, the corporation may be limited in the number of raw materials it can obtain.
Chi-Square Test
- A chi-square test is a statistical test that compares observed and anticipated outcomes. The purpose of this test is to determine whether a difference between actual and projected data is due to coincidence or to a relationship between the variables under examination.
- Degrees of freedom are used in these tests to determine whether a null hypothesis can be rejected based on the overall number of variables and samples in the experiment.
Example – When it comes to students and course selection, for example, a sample size of 30 or 40 students is unlikely to yield substantial data. It is more valid to obtain the same or comparable results from a study with a sample size of 400 or 500 students.
T- Test
- A statistical test called a t test is employed to compare the means of two groups. It is frequently employed in hypothesis testing to establish whether a procedure or treatment truly affects the population of interest or whether two groups differ from one another.
- You must determine the sample’s value of t and compare it to a critical value in order to conduct a t-test. The critical value will vary, and by using the t distribution of a data set with the degree of freedom, you may ascertain the proper critical value.
Example – A T-test can be used, for instance, to determine whether the mean length of petals of a flower from two distinct species is the same. The user can reach a predetermined conclusion by choosing randomly two petals from the other species of that flower. Either of the following two methods may be used to determine the final T-test interpretation:
-
- When the means are equal and the difference between them is 0, this is referred to be a null hypothesis.
- An alternative theory suggests that the difference between the means is not zero. The data set is quite exact and not by accident, according to this hypothesis, which rejects the null hypothesis.


 Haryana NEET Counselling 2026: Registrat...
 Gujarat NEET Counselling 2026: Registrat...
 MP NEET Counselling 2026: Registration, ...