arrow
arrow
arrow
According to Arrhenius equation, the plot that correctly describes the temperature (T) dependence of the rate constant (k) is
Question

According to Arrhenius equation, the plot that correctly describes the temperature (T) dependence of the rate constant (k) is

A.

B.

C.

D.

Correct option is A

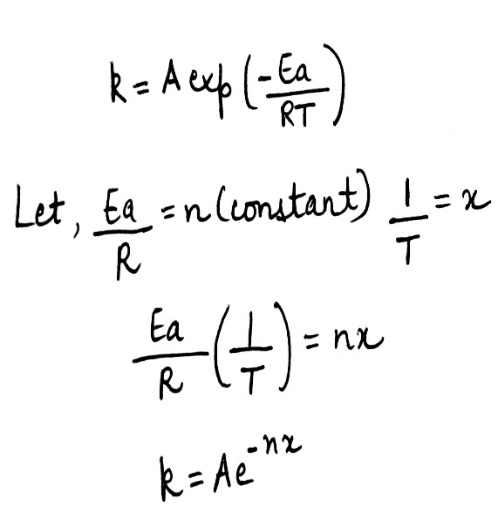
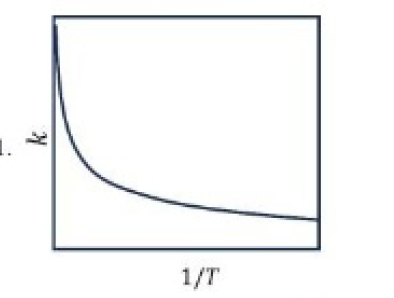
The main characteristics of Arrhenius equation are described below.
1.Larger the activation energy, smaller the value of rate constant.
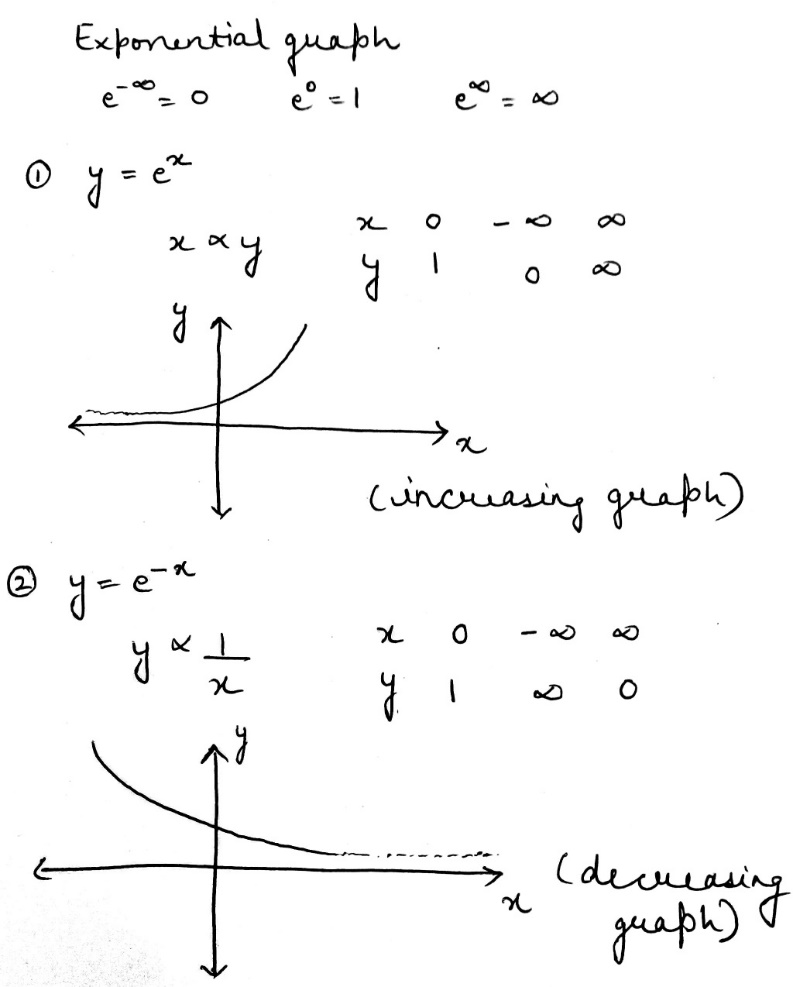
2.Larger the activation energy, greater the effect of a given temperature rise on k.
3.At lower temperatures, increase in temperature causes more change in the value of k than that at higher temperatures.

Similar Questions

test-prime-package

Access ‘CSIR NET Chemical Sciences’ Mock Tests with

  • 60000+ Mocks and Previous Year Papers
  • Unlimited Re-Attempts
  • Personalised Report Card
  • 500% Refund on Final Selection
  • Largest Community
students-icon
368k+ students have already unlocked exclusive benefits with Test Prime!
Our Plans
Monthsup-arrow