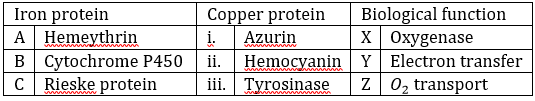
Correct option is A
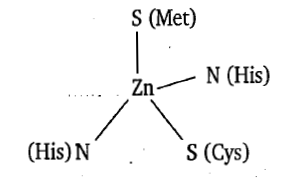
Plastocyanin is found in chloroplasts of green plants and blue-green algae. Plastocyanin has molar mass about 10500. It contains one copper atom per molecule. Plastocyanin is involved in electron transfer in photosynthesis (between PS I and PS II). The protein chain in plastocyanin contains 97-104 amino acid residues. The copper centre in plastocyanin is coordinated to two N atoms of imidazoles of histidine residues, one S of methionine and one S of thiol of cysteine residues in distorted tetrahedral arrangement (or flattened tetrahedron) . The arrangement about copper centre involves three short bonds in an trigonal planar arrangement with fourth longer bond to S of methionine.
In the EPR spectra of copper-containing compounds, the A∥ hyperfine coupling constants reflect the electronic structure of the copper ion. Plastocyanine shows smaller A∥ values than CuCl₄2-, which is indicative of its distinct electronic environment.
Additional Knowledge
Electron paramagnetic resonance (EPR) spectroscopy (also called electron spin resonance (ESR) spectroscopy), is used to study paramagnetic species with one or more unpaired electrons, e.g. free radicals, diradicals, metal complexes containing paramagnetic metal centres, defects in semiconductors and irradiation effects in solids. While diamagnetic materials are EPR silent, paramagnetic species always exhibit an EPR spectrum. This consists of one or more lines, depending on the interactions between the unpaired electron (which acts as a ‘probe’) and the molecular framework in which it is located. Analysis of the shape of the EPR spectrum (the number and positions of EPR lines, their intensities and line widths) provides information about the paramagnetic species, e.g. the structure of a free radical, characterization of the coordination sphere around the metal centre in a coordination complex, or the presence of multiple paramagnetic species.
EPR spectroscopic measurements can be performed at high, room or low (4 K) temperature. Samples may be solid (single crystal or powder) or liquid (fluid or frozen solution, a ‘glass’).
The Zeeman electronic effect
For a paramagnetic metal ion such as Cu2+(d9) with a single unpaired electron, the total spin quantum number S=1/2. There are two possible spin states: Ms = +1/2 and Ms = -1/2. In the absence of a magnetic field, these states are degenerate. Consider a one-electron case. By applying a magnetic field, Bo, the interaction between the unpaired electron and the magnetic field leads to a splitting of the energy levels. This is called the Zeeman electronic effect and the energy difference, is given by
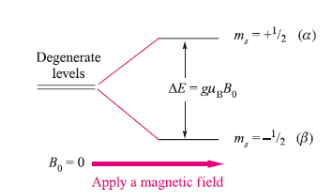
The g-value is given by the ratio 2μe/μB where μe is the electron magnetic moment (9.2848 × 10⁻²⁴JT-1); g is dimensionless. For a free electron, g = 2.0023. For a metal ion, spin orbit coupling leads to g-values that are significantly different from that of a free electron. The energy separation between the alpha and beta states corresponds to the microwave region of the electromagnetic spectrum. Thus, by supplying appropriate microwave radiation to the sample, electron spin transitions between the two energy states occur. The system is then in resonance, and the recording of these transitions represents the EPR spectrum. Usually, an EPR spectrometer operates at a constant microwave frequency (measured in gigahertz, GHz) and the magnetic field (measured in gauss or tesla, 1G=10-4T) is varied until the energy separation of the two spin states coincides with the microwave radiation energy. Standard EPR spectrometers operate at 9–10 GHz (so-called ‘X-band’), but there are also domains of lower and higher microwave frequencies: 1–2GHz (L-band), 2–4 GHz (S-band), 35 GHz (Q-band) and 95 GHz (W-band). Recently developed FT-EPR spectrometers (as opposed to continuous wave instruments) produce increased spectral resolution and their use has widened the scope of systems that can be investigated (e.g. the second coordination sphere around a paramagnetic metal centre in a metalloprotein).
EPR Spectra
The form in which an EPR spectrum is recorded is the first derivative of an absorption peak, because in this form the detection is more sensitive and the signal : noise ratio is improved due to intrinsic electronic properties resulting from modulation of the magnetic field. The point at which the derivative curve is zero (i.e. crosses the baseline) corresponds to the absorption maximum, and the magnetic field, Bsample , at this
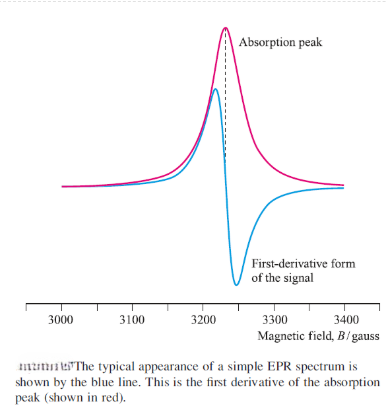
point is recorded. The g-value for the sample is found by substituting the value of Bsample
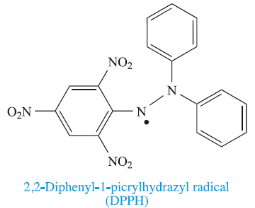
The experimental g-value can be found directly since the frequency, v, of a modern spectrometer is known accurately, h = Planck constant, and μB = Bohr magneton (a constant). For old spectrometers, or where a calibration is required, gsample can be found by comparing the value of Bsample with that of an internal reference material for which g is known (e.g. for the reference DPPH, g = 2.0036).
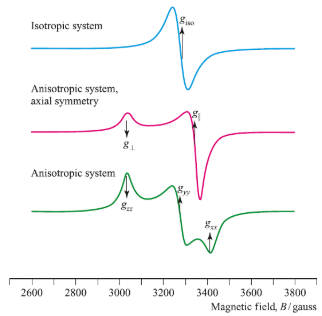
The g-value obtained from an EPR experiment provides diagnostic information about the system being investigated. For a paramagnetic metal centre, the g-value is characteristic of the oxidation state (i.e. the number of unpaired electrons), the coordination environment and the molecular symmetry. However, unless a system has cubic symmetry (i.e. it belongs to the Td, Oh or Ih point groups and is isotropic), the g-value depends on the orientation of the molecular principal axis with respect to the magnetic field. Such systems are said to be anisotropic. By rotation of the sample placed in the magnetic field in three orthogonal planes, three g-values are therefore obtained. Each g-value is associated with one of the three orthogonal axes. Three cases must now be considered:
For an isotropic system (e.g. an MX6 species with Oh symmetry), the three g-values are equal to one another (gxx=gyy=gzz= giso). A system that is anisotropic, but has axial symmetry, has two axes (x and y) that are equivalent but are different from the principal axis, z. This gives rise to two g-values labelled g∥ and g⊥ (gxx= gyy=g∥ and gzz= g⊥) depending on whether the molecular principal axis is aligned parallel to or perpendicular to the magnetic field. An anisotropic system in which each of the x, y and z axes is unique gives rise to three g-values (gxx, gyy and gzz).
In addition to the information available from g-values, we can obtain information about nuclei with nuclear spin quantum number I≠0 which are close to the paramagnetic centre. The spins of such nuclei interact magnetically with the unpaired electron and give rise to a hyperfine interaction. There is a direct analogy here with coupling of nuclear spins in NMR spectroscopy. The hyperfine interaction is added to the Zeeman electronic interaction, leading to a further splitting of the energy levels.