Correct option is A
Explanation:
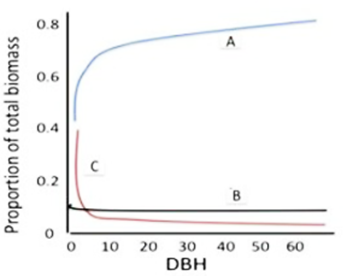
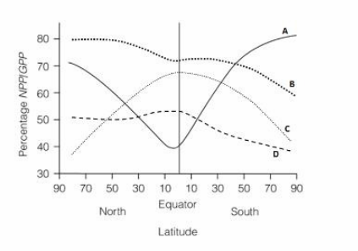
The relationship between the Net Primary Productivity (NPP) and Gross Primary Productivity (GPP) ratio varies with latitude, and the curve A correctly represents this relationship. Here's a breakdown of why curve A is correct:
NPP/GPP ratio refers to the fraction of total carbon assimilated by plants (GPP) that is converted into biomass and stored as net primary productivity (NPP). The higher the NPP/GPP ratio, the more efficient plants are in storing carbon, and the less is lost to respiration.
Near the equator (around 0° latitude), plant productivity (both NPP and GPP) is high, and the climate is favorable for photosynthesis year-round. At the equator, NPP/GPP ratio is also higher, as plants are less likely to lose carbon to respiration and are more efficient at converting solar energy into biomass.
At higher latitudes (closer to 90° north and south), the NPP/GPP ratio decreases because of factors such as lower light intensity, shorter growing seasons, and colder temperatures, which reduce photosynthetic activity and efficiency. Therefore, the GPP tends to be higher relative to NPP, resulting in a lower NPP/GPP ratio.
Thus, curve A correctly depicts the gradual increase in the NPP/GPP ratio near the equator and its decrease as we move towards higher latitudes in both the northern and southern hemispheres.
Why the other options are incorrect:
Option (2) B: This curve does not properly reflect the pattern where NPP/GPP ratio is highest at the equator and decreases at higher latitudes. It shows a constant or incorrect variation in the NPP/GPP ratio across latitudes.
Option (3) C: This curve incorrectly suggests a significant increase in the NPP/GPP ratio at higher latitudes, which does not align with observed ecological patterns.
Option (4) D: This curve also does not match the expected trend for the NPP/GPP ratio with latitude, showing an unrealistic variation.