arrow
arrow
arrow
​The figure below represents a bipartite network of species interactions between two trophic levels. Each link represents an interaction between a spe
Question

The figure below represents a bipartite network of species interactions between two trophic levels. Each link represents an interaction between a species in the higher trophic level (A to H) and a species in the lower trophic level (I to P).

Given below are a few statements describing potential conclusions that can be drawn from the network:

A. If the network represents predator species (A-H) and prey species (I-P), then D is an apex predator.
B. If the network represents plant species (I-P) and pollinator species (A-H), then species I is more likely to experience local extinction than K.
C. The network is more stable if D is removed and the population size of O increases.
D. If the network represents frugivore species (A-H) and plant species (I-P), then M is a keystone species.

Which one of the options given below represents all correct statement/s that can be inferred from the network above?

A.

A and B only

B.

A, B and C

C.

B, C and D

D.

B only

Correct option is D

EXPLANATION-

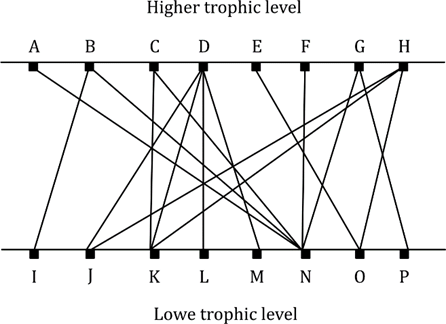
A. If the network represents predator species (A–H) and prey species (I–P), then D is an apex predator.
Species D interacts with 5 species (I, J, K, L, M), more than most other top-level species. However, being an apex predator is not solely about number of prey, but also about not being preyed upon, which isn’t shown in this bipartite (only two levels).
Conclusion: Not necessarily true. So, A is not valid.

B. If the network represents plant species (I–P) and pollinator species (A–H), then species I is more likely to experience local extinction than K.
Species I is connected to only one species (A), while K is connected to multiple (A, B, C, E). So, if A disappears, I loses all interactions; K still has others.
Conclusion: True – I is more vulnerable.

C. The network is more stable if D is removed and the population size of O increases.
Species D interacts with many species (I, J, K, L, M), so its removal reduces top-down pressure. Species O is only connected to one top-level species (H). Increasing O’s population alone doesn’t increase network stability unless it supports interactions.
Conclusion: Uncertain/Speculative – not enough evidence. Likely not true.

D. If the network represents frugivore species (A–H) and plant species (I–P), then M is a keystone species.

M is connected to 4 frugivores (C, D, E, G), more than most other bottom-level species. Its loss could affect multiple higher trophic species.
Conclusion: Likely true – fits the keystone role.

Only B and D are supported.

So, the correct option is: Option (c)  B only.


Similar Questions

test-prime-package

Access ‘CSIR NET Life Sciences’ Mock Tests with

  • 60000+ Mocks and Previous Year Papers
  • Unlimited Re-Attempts
  • Personalised Report Card
  • 500% Refund on Final Selection
  • Largest Community
students-icon
354k+ students have already unlocked exclusive benefits with Test Prime!
Our Plans
Monthsup-arrow