arrow
arrow
arrow
​The following graph shows the change in proportion of biomass in foliage (leaves), branch and stemwood (bole) for a tree species as a function of DBH
Question

The following graph shows the change in proportion of biomass in foliage (leaves), branch and stemwood (bole) for a tree species as a function of DBH (diameter at 1.5 m above ground).

Which one of the following options correctly matches the curves (A, B, and C) with stemwood, foliage and branch, respectively?

A.

A, B and C

B.

A, C and B

C.

B, C and A

D.

B, A and C

Correct option is B

Explanation-

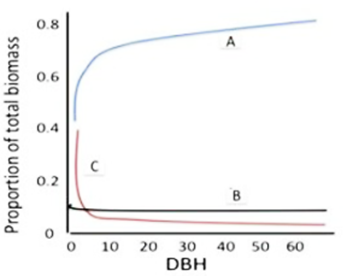
Curve A (steep increase, high proportion, stabilizes at high DBH):
Likely Stemwood
As tree diameter increases, stemwood becomes the major component of biomass. Its proportion increases sharply and dominates at larger DBH.

Curve B (low and fairly constant proportion):
 Likely Foliage (leaves)
Foliage contributes a relatively small and stable proportion of total biomass regardless of DBH. Trees maintain similar leaf biomass across sizes.

Curve C (high at low DBH, then decreases):
 Likely Branch
Branch biomass is higher in younger/smaller trees, but as stemwood dominates in large trees, the proportional contribution of branches decreases.

Correct Matching:
A – Stemwood
C – Branch
B – Foliage

This corresponds to Option B

Similar Questions

test-prime-package

Access ‘CSIR NET Life Sciences’ Mock Tests with

  • 60000+ Mocks and Previous Year Papers
  • Unlimited Re-Attempts
  • Personalised Report Card
  • 500% Refund on Final Selection
  • Largest Community
students-icon
354k+ students have already unlocked exclusive benefits with Test Prime!
Our Plans
Monthsup-arrow