Correct option is B
Explanation-
Given -
Now, use the energy flow relationship:
Also,
Final values:
Pn = 14 kcal
NA = 130 kcal
R = 56 kcal
I = 200 kcal
Correct order: 14, 130, 56, 200 → Option b


The diagram below depicts energy flow within a single trophic level, where I = amount ingested, NA = amount not assimilated, R = respiration, and Pn = biomass production at the trophic level.
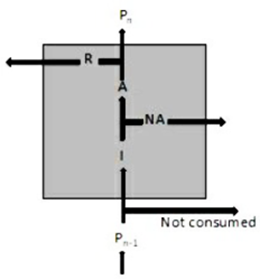
Which one of the following options represents correct values for Pn, NA, R and I in kcal respectively, if Pn –1 = 1000 kcal, I/Pn–1=20%, A/I=35× and Pn/A=20%?
Explanation-
Given -
Now, use the energy flow relationship:
Also,
Final values:
Pn = 14 kcal
NA = 130 kcal
R = 56 kcal
I = 200 kcal
Correct order: 14, 130, 56, 200 → Option b
Select the correct combination of factors which drive the extinction vortex.
The following graph shows the change in proportion of biomass in foliage (leaves), branch and stemwood (bole) for a tree species as a function of DBH (diameter at 1.5 m above ground).
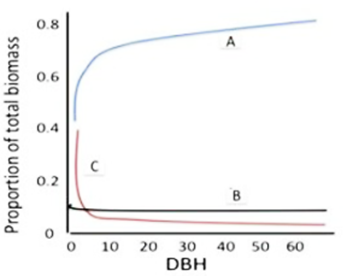
Which one of the following options correctly matches the curves (A, B, and C) with stemwood, foliage and branch, respectively?
The diagram below depicts energy flow within a single trophic level, where I = amount ingested, NA = amount not assimilated, R = respiration, and Pn = biomass production at the trophic level.
Which one of the following options represents correct values for Pn, NA, R and I in kcal respectively, if Pn –1 = 1000 kcal, I/Pn–1=20%, A/I=35× and Pn/A=20%?
Study the global ecosystem data provided in the following table.
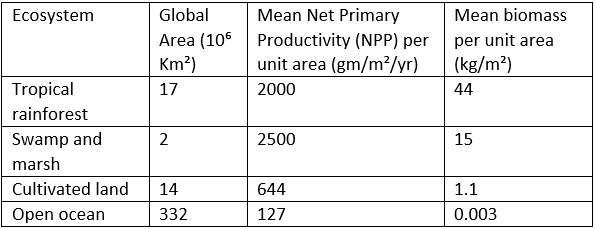
Based on the data provided in the table, choose the correct option that represents ecosystems with the highest global primary production and the highest relative NPP, respectively.
The figure below represents a bipartite network of species interactions between two trophic levels. Each link represents an interaction between a species in the higher trophic level (A to H) and a species in the lower trophic level (I to P).
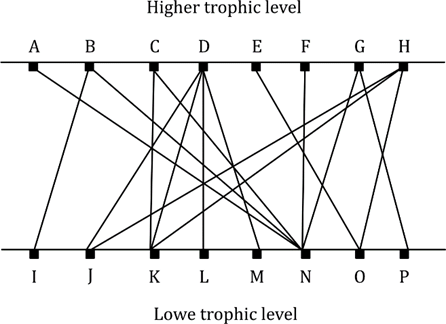
Given below are a few statements describing potential conclusions that can be drawn from the network:
A. If the network represents predator species (A-H) and prey species (I-P), then D is an apex predator.
B. If the network represents plant species (I-P) and pollinator species (A-H), then species I is more likely to experience local extinction than K.
C. The network is more stable if D is removed and the population size of O increases.
D. If the network represents frugivore species (A-H) and plant species (I-P), then M is a keystone species.
Which one of the options given below represents all correct statement/s that can be inferred from the network above?
The following table shows forest floor litter pool and aboveground litterfall data for three forest types.
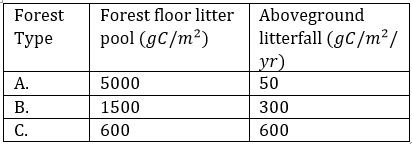
Based on the provided information, which one of the following options accurately identifies the various forest types?
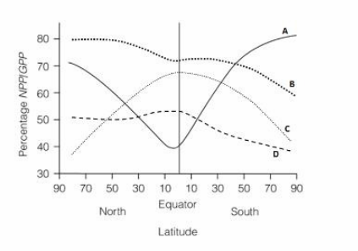
Which one of the following curves correctly depicts the relationship of the NPP/GPP ratio with latitude?
The table below lists terminologies (Column X) and concepts (Column Y) related to ecological niche.
Column X | Column Y |
A. Niche complementarity | i. Species distribution explained by trophic levels and biotic interactions. |
B. Niche packing | ii. Tendency for coexisting species which occupy a similar position along at least one niche dimension. |
C. Community niche | iii. Tendency for coexisting species to fill the available space along important niche dimensions. |
D. Eltonian niche | iv. Composition of niches of all individual species that co-occur at the same site. |
Which one of the following options represents the correct match between column X and column Y?
Which one of the following graphs typically represents the change in C:N ratio over time in decomposing leaf litter in temperate forests?
Nutrients are gained or lost by ecosystems in a variety of ways. These nutrients may accumulate in different organic or inorganic pools over time. The different pools of phosphorus are:
i. Mineral inorganic phosphorus
ii. Labile (available) phosphorus
iii. Occluded inorganic phosphorus
iv. Soil organic phosphorus
v. Plant organic phosphorus
The following graph shows the generalized change in phosphorus dynamics during primary succession:
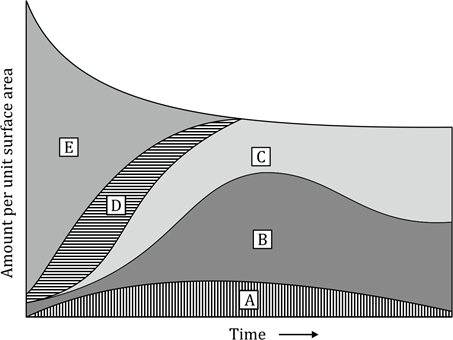
Which one of the following options correctly matches the region (A to E) shown in the graph to the phosphorus pool?

Select the correct combination of factors which drive the extinction vortex.
The following graph shows the change in proportion of biomass in foliage (leaves), branch and stemwood (bole) for a tree species as a function of DBH (diameter at 1.5 m above ground).
Which one of the following options correctly matches the curves (A, B, and C) with stemwood, foliage and branch, respectively?
The diagram below depicts energy flow within a single trophic level, where I = amount ingested, NA = amount not assimilated, R = respiration, and Pn = biomass production at the trophic level.
Which one of the following options represents correct values for Pn, NA, R and I in kcal respectively, if Pn –1 = 1000 kcal, I/Pn–1=20%, A/I=35× and Pn/A=20%?
Study the global ecosystem data provided in the following table.
Based on the data provided in the table, choose the correct option that represents ecosystems with the highest global primary production and the highest relative NPP, respectively.
The figure below represents a bipartite network of species interactions between two trophic levels. Each link represents an interaction between a species in the higher trophic level (A to H) and a species in the lower trophic level (I to P).
Given below are a few statements describing potential conclusions that can be drawn from the network:
A. If the network represents predator species (A-H) and prey species (I-P), then D is an apex predator.
B. If the network represents plant species (I-P) and pollinator species (A-H), then species I is more likely to experience local extinction than K.
C. The network is more stable if D is removed and the population size of O increases.
D. If the network represents frugivore species (A-H) and plant species (I-P), then M is a keystone species.
Which one of the options given below represents all correct statement/s that can be inferred from the network above?
The following table shows forest floor litter pool and aboveground litterfall data for three forest types.
Based on the provided information, which one of the following options accurately identifies the various forest types?
Which one of the following curves correctly depicts the relationship of the NPP/GPP ratio with latitude?
The table below lists terminologies (Column X) and concepts (Column Y) related to ecological niche.
Column X | Column Y |
A. Niche complementarity | i. Species distribution explained by trophic levels and biotic interactions. |
B. Niche packing | ii. Tendency for coexisting species which occupy a similar position along at least one niche dimension. |
C. Community niche | iii. Tendency for coexisting species to fill the available space along important niche dimensions. |
D. Eltonian niche | iv. Composition of niches of all individual species that co-occur at the same site. |
Which one of the following options represents the correct match between column X and column Y?
Which one of the following graphs typically represents the change in C:N ratio over time in decomposing leaf litter in temperate forests?
Nutrients are gained or lost by ecosystems in a variety of ways. These nutrients may accumulate in different organic or inorganic pools over time. The different pools of phosphorus are:
i. Mineral inorganic phosphorus
ii. Labile (available) phosphorus
iii. Occluded inorganic phosphorus
iv. Soil organic phosphorus
v. Plant organic phosphorus
The following graph shows the generalized change in phosphorus dynamics during primary succession:
Which one of the following options correctly matches the region (A to E) shown in the graph to the phosphorus pool?