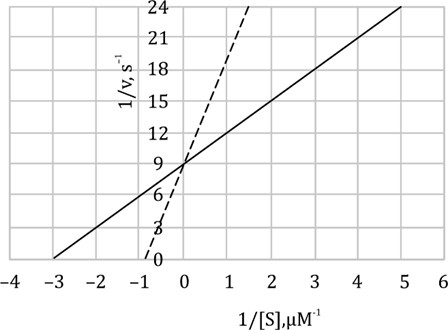
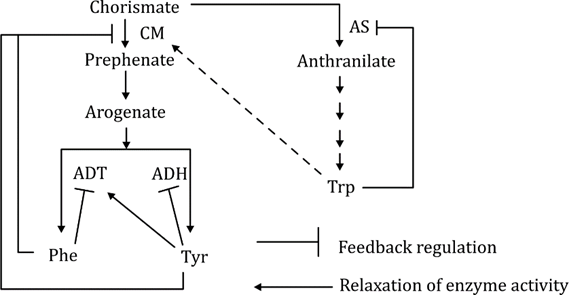
The figure below depicts the allosteric regulation in the biosynthesis of three aromatic amino acids - Phe, Tyr and Trp, acting at four major steps catalyzed by enzymes, CM, AS, ADT and ADH. The feedback regulation and relaxation of enzyme activities by the end-product amino acids are marked.
Following assumptions are made regarding the pool of aromatic amino acids in the feedback-insensitive mutants of these allosteric enzymes.
A. The feedback-insensitive mutant of CM will show higher pool of Phe and Tyr.
B. The feedback-insensitive mutant of AS will increase only Trp pool.
C. The feedback-insensitive mutant of AS will show higher pool of Trp, Phe and Tyr.
D. In feedback-insensitive mutant of ADH, only Tyr pool is decreased.
E. In feedback-insensitive mutant of ADH, both Tyr and Phe pools are increased transiently.
Which one of the following options represents a combination of all correct assumptions?