hamburger menu
All Coursesall course arrow
adda247
reward-icon
adda247
    arrow
    arrow
    arrow
    ​A student was asked to plot a graph representing enzyme kinetic data for initial velocity, v₀, and substrate concentration, [S] using any of the equa
    Question

    A student was asked to plot a graph representing enzyme kinetic data for initial velocity, v₀, and substrate concentration, [S] using any of the equations given below. The student used an equation for which neither X-axis nor Y-axis had independent variables. Which one of the following equations might the student have used?

    A.

    1/v0=(Km/Vmax)(1/[S])+1/Vmax1/v_0 = (K_m/V_{max})(1/[S]) + 1/V_{max}​​

    B.

    [S]/v0=[S]/Vmax+(Km/Vmax)[S]/v₀ = [S]/V_{max}⁡ + (Kₘ/V_{max}⁡ )​​

    C.

    v0/[S]=(Vmax/Km)v0/Kmv₀/[S] = (V_{max}⁡ /Kₘ) - v₀/Kₘ​​

    D.

    v0=Vmax[S]/(Km+[S])v₀ = V_{max}⁡ [S] / (Kₘ + [S])​​

    Correct option is C

    The basic Michaelis-Menten equation:

    v0=Vmax[S]Km+[S]v_0 = \frac{V_{\text{max}} [S]}{K_m + [S]}

    where:

    V0 = Initial velocity ( Dependent on [S])

    [S] : Substrate concentration (Independent Variable)

    Vmax and Km: Constants

    In most plots:

    Either [S] or 1[S]\frac{1}{[S]} is the independent variable (x- axis)

    and V0 and 1[V0]\frac{1}{[V_0]} is plotted on y- axis

    We are looking for an equation that does not plot a true independent variable on either axis—in other words, both axes depend on experimental data or a mixture of variables.

    Option Analysis:

    1. Option 1: 1v0=(Km/Vmax[S])+(1Vmax)\frac{1}{v_0} = \left( \frac{K_m / V_{\text{max}}}{[S]} \right) + \left( \frac{1}{V_{\text{max}}} \right)

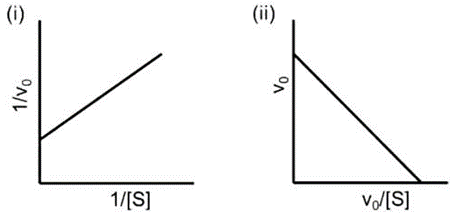
      ​This is the Lineweaver-Burk equation: plots 1V0\frac{1}{V_0}​ vs. 1/[S]1/[S]1/[S], both are derived from experimental variables, but [S] is independent.

      Option 2: [S]v0=[S]Vmax+KmVmax\frac{[S]}{v_0} = \frac{[S]}{V_{\text{max}}} + \frac{K_m}{V_{\text{max}}}

      ​This is the Eadie-Hofstee equation: plots [S]/v0[S]/v_0[S]V0\frac{[S]}{V_0}​ vs. [S][S][S], so [S] is still on an axis, i.e., independent.

      Option 3: v0[S]=(VmaxKm)v0Km\frac{v_0}{[S]} = \left( \frac{V_{\text{max}}}{K_m} \right) - \frac{v_0}{K_m}

      ​This equation involves both v0v_0V0V_0​ and [S][S][S] on both sides — neither axis is strictly independent.
      → This is a rearranged form, similar to the Woolf-Augustinsson-Hofstee plot, which plots V0V_0​ vs. V0[S]\frac{V_0}{[S]}

      ​Hence, both axes are combinations of dependent variables.

      Option 4: v0=Vmax[S]Km+[S]v_0 = \frac{V_{\text{max}} [S]}{K_m + [S]}

    Original Michaelis-Menten form. Clearly, [S] is the independent variable.

    Correct Answer: Option 3

    It uses a plot where neither axis (neither v0v_0V0V_0​ nor V0[S]\frac{V_0}{[S]}​ is an independent variable, as both are derived from experimental data.


    Similar Questions

    test-prime-package

    Access ‘CSIR NET Life Sciences’ Mock Tests with

    • 60000+ Mocks and Previous Year Papers
    • Unlimited Re-Attempts
    • Personalised Report Card
    • 500% Refund on Final Selection
    • Largest Community
    students-icon
    383k+ students have already unlocked exclusive benefits with Test Prime!
    Our Plans
    Monthsup-arrow