Correct option is B
Explanation-
Step-by-step Interpretation:
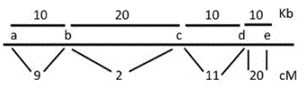
Look at the physical map:
It shows how far genes are physically apart on the DNA molecule, measured in Kb.
Example from the figure:
a to b = 10 Kb
b to c = 20 Kb
d to e = 10 Kb, etc.
Look at the genetic map:
It shows how frequently recombination occurs between those genes, measured in cM. Recombination happens during meiosis and helps us understand genetic linkage.
Example from the figure:
a to b = 9 cM
b to c = 2 cM
d to e = 20 cM
Calculate recombination rate:
Use the formula:
This tells you how much recombination happens per kilobase of DNA.
Compare rates:
Higher cM/Kb = more recombination per unit DNA = more recombinogenic
Lower cM/Kb = less recombination = less recombinogenic
Example from the question:
Region and its recombination Rate (cM/Kb)
a–b : 0.9
b–c : 0.1
c–d : 1.1
d–e : 2.0 ← highest
Final Answer
The region between d and e shows the highest recombination rate (2.0 cM/Kb), making it the most recombinogenic. This is more than the a–b region (0.9 cM/Kb), so the correct interpretation is that d–e is more recombinogenic than a–b, which matches Option b.