Correct option is D
The correct answer is: (4) A and C only
Explanation :Let's break down each statement and match them with the figures:
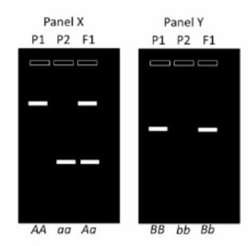
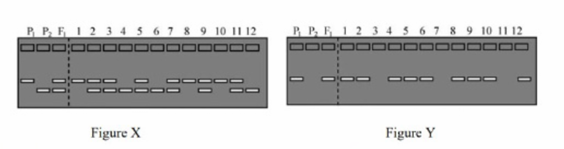
Figure X: Represents the segregation of a codominant marker in an F2 population. In this case, codominant markers show both alleles separately in the progeny, and this pattern is observed in Figure X. Each individual shows distinct bands that correspond to either of the two parental alleles. This indicates that Figure X corresponds to the segregation pattern in an F2 population using a codominant marker.
Figure Y: Represents the segregation of a dominant marker in a doubled haploid population. A dominant marker typically results in a pattern where only one band type is observed because only one allele is present in the offspring due to the nature of doubled haploids (which carry only one allele from each parent). This is what is seen in Figure Y, where there is no separation of bands, indicating that it is a dominant marker.
Now, let's assess the statements:
Statement A: "Figure X represents the profile of a codominant marker in an F2 population." This is correct. As mentioned, Figure X clearly shows codominant markers in an F2 population, where both alleles are represented as separate bands.
Statement B: "Figure Y represents the profile of a codominant marker in a doubled haploid population." This is incorrect. Figure Y shows a dominant marker, not a codominant marker, and it represents a doubled haploid population, not an F2 population.
Statement C: "Figure Y represents the profile of a dominant marker in an F2 population." This is correct. Figure Y does show a dominant marker, and it is an F2 population.
Statement D: "Figure X represents the profile of a dominant marker in a doubled haploid population." This is incorrect. Figure X shows a codominant marker, not a dominant marker, and is in an F2 population, not a doubled haploid.
Thus, the correct combination of correct statements is A and C only.
Information Booster:
Codominant markers allow for the detection of both alleles separately, which is clearly demonstrated in Figure X.
In an F2 population, individuals inherit alleles from both parents, which results in the clear representation of both parental alleles (as seen in Figure X).
Dominant markers show only one band in the offspring, as seen in Figure Y, because the marker only detects the presence of one allele.
In a doubled haploid population, only one allele is expressed due to the haploid nature of the population, leading to a simplified segregation pattern seen in Figure Y.
The F2 population shows both alleles from the parents in the progeny, which is why codominant markers are useful for observing this segregation pattern.
Additional Information:
Figure X shows the expected segregation for codominant markers in an F2 population. The presence of two distinct bands in the offspring confirms this.
Figure Y shows dominant markers in a doubled haploid population, where the lack of multiple bands (only one band is visible) reflects the presence of only one allele.