Correct option is A
Correct Answer: 1. Based on the species accumulation curve
Explanation:
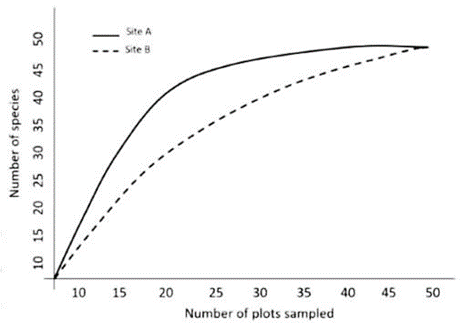
A species accumulation curve (SAC) plots the cumulative number of species detected against the sampling effort (e.g., number of individuals or sampling units).
It is widely used to assess whether the sampling effort has been sufficient.
When the curve levels off, it suggests that most species in the area have been sampled and additional effort is unlikely to discover many new species.
Thus, it's the best method to evaluate whether your sampling has reasonably captured the community's species diversity.
Why other options are incorrect:
Option 2: Incorrect – Sampling effort and species richness are not independent. Without enough effort, many species (especially rare ones) can be missed.
Option 3: Morisita-Horn similarity index compares community similarity (especially in species abundance) between two sites, not sampling sufficiency within a single site.
Option 4: Simpson’s diversity index measures diversity (evenness and richness) but does not assess sampling adequacy. It assumes a sufficient sampling base to be meaningful.
Information Booster:
Species Accumulation Curve:
X-axis: Sampling effort (e.g., individuals, plots)
Y-axis: Cumulative number of species
A plateau in the curve suggests enough sampling.
Used in: Ecology, conservation biology, biodiversity studies to estimate true species richness.