Correct option is A
Let’s analyze each statement in the context of the graph:
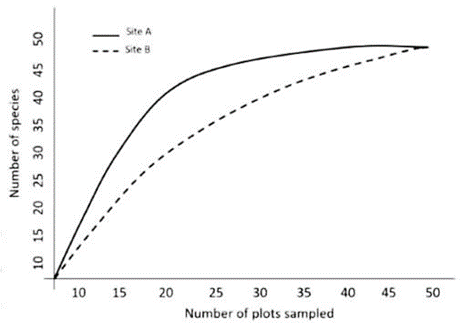
Statement A:In both sites, sampling more plots will not add any more species.
→ This is incorrect. Although the curves are flattening, neither Site A nor Site B has reached a complete plateau. The species count is still marginally increasing with additional sampling, meaning more species could be discovered.Statement C:Sites A and B are likely to have similar species richness.
→ This is also incorrect. Site A consistently shows a higher number of species across all sampling efforts, and even at the highest number of plots sampled, Site A remains higher than Site B, suggesting Site A is richer.
Thus, A and C are both incorrect statements.