arrow
arrow
arrow
This Chart shows the investment in 3 sectors – manufacturing, services and defence – in five different years. All values are in lakhs Rupees.Which yea
Question

This Chart shows the investment in 3 sectors – manufacturing, services and defence – in five different years. All values are in lakhs Rupees.

Which year has highest investment in all three sectors together?

A.

2005

B.

2006

C.

2004

D.

2007

Correct option is B

Formula Used:

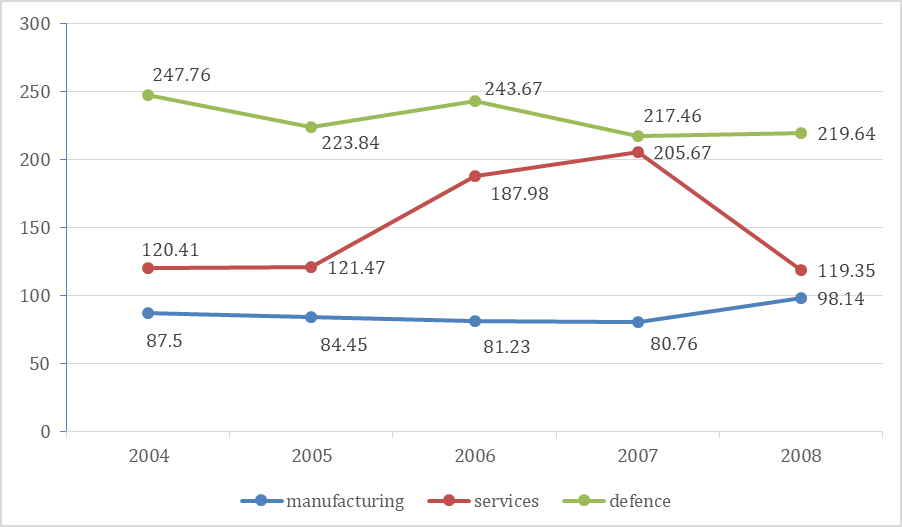
Total Investment per year = Manufacturing + Services + Defence

Solution:

Year

Manufacturing

Services

Defence

Total

2004

87.5

120.41

247.76

455.67

2005

84.45

121.47

223.84

429.76

2006

81.23

187.98

243.67

512.88

2007

80.76

205.67

217.46

503.89

2008

98.14

119.35

219.64

437.13

Highest total investment was in 2006 with a combined investment of ₹512.88 lakhs.

Free Tests

Free
Must Attempt

CBT-1 Full Mock Test 1

languageIcon English
  • pdpQsnIcon100 Questions
  • pdpsheetsIcon100 Marks
  • timerIcon90 Mins
languageIcon English
Free
Must Attempt

RRB NTPC Graduate Level PYP (Held on 5 Jun 2025 S1)

languageIcon English
  • pdpQsnIcon100 Questions
  • pdpsheetsIcon100 Marks
  • timerIcon90 Mins
languageIcon English
Free
Must Attempt

CBT-1 General Awareness Section Test 1

languageIcon English
  • pdpQsnIcon40 Questions
  • pdpsheetsIcon30 Marks
  • timerIcon25 Mins
languageIcon English

Similar Questions

test-prime-package

Access ‘RRB NTPC’ Mock Tests with

  • 60000+ Mocks and Previous Year Papers
  • Unlimited Re-Attempts
  • Personalised Report Card
  • 500% Refund on Final Selection
  • Largest Community
students-icon
354k+ students have already unlocked exclusive benefits with Test Prime!
Our Plans
Monthsup-arrow