arrow
arrow
arrow
The graph shows cumulative frequency percentage of research scholars and the number of papers published by them. Which of the following statements is
Question

The graph shows cumulative frequency percentage of research scholars and the number of papers published by them. Which of the following statements is true?

A.

Majority of the scholar published more than 4 papers

B.

60% of the scholar published at least 2 papers

C.

80% of the scholar published at least 6 papers

D.

30% of the scholars have not published any paper

Correct option is B

Solution:

Option A:

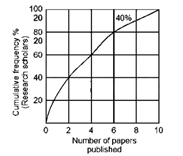
From the above graph, it is clear that only 40% of the scholars published more than 4 papers, which are not in majority.

Hence, option A is incorrect.

Option B:

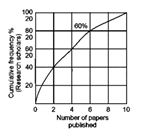
From the above graph, it is clear that 60% of the scholars have published 2 or more than 2 papers.

Hence, option B is correct.

Option C:

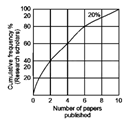
From the above graph, it is clear that only 20% of the scholars have published at least 6 papers.

Hence, option C is incorrect.

Option D:

It is incorrect as all the scholars have published the papers.

∴ From the graph it is clear that, 60% of the scholar have published at least 2 papers.

Final Answer: (B)

Similar Questions

TEST PRIME

Access ‘CSIR NET- GENERAL APTITUDE’ Mock Tests with

  • 60000+ Mocks and Previous Year Papers
  • Unlimited Re-Attempts
  • Personalised Report Card
  • 500% Refund on Final Selection
  • Largest Community
1 month
students-icon
368k+ students have already unlocked exclusive benefits with Test Prime!
Our Plans
Monthsup-arrow