Correct option is D
Solution:
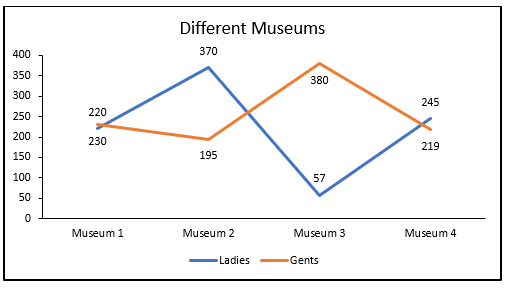
Total visitors in museum 1 = 220 + 230 = 450
Total visitors in museum 2 = 370 + 195 = 565
Total visitors in museum 3 = 380 + 57 = 437
Total visitors in museum 4 = 245 + 219 = 464
Museum 2 had maximum number of visitors.







The graph shows number of visitors (ladies and gents) in four different museums namely 1, 2, 3 and 4.
Which museum had the maximum number of visitors?
Solution:
Total visitors in museum 1 = 220 + 230 = 450
Total visitors in museum 2 = 370 + 195 = 565
Total visitors in museum 3 = 380 + 57 = 437
Total visitors in museum 4 = 245 + 219 = 464
Museum 2 had maximum number of visitors.
 English
 80 Questions
 160 Marks
 60 Mins English English80 Questions160 Marks60 Mins English English20 Questions40 Marks25 Mins English
The line chart given below shows the number of calories burnt by a person on 6 consecutive days DY1, DY2, DY3, DY4, DY5 and DY6.
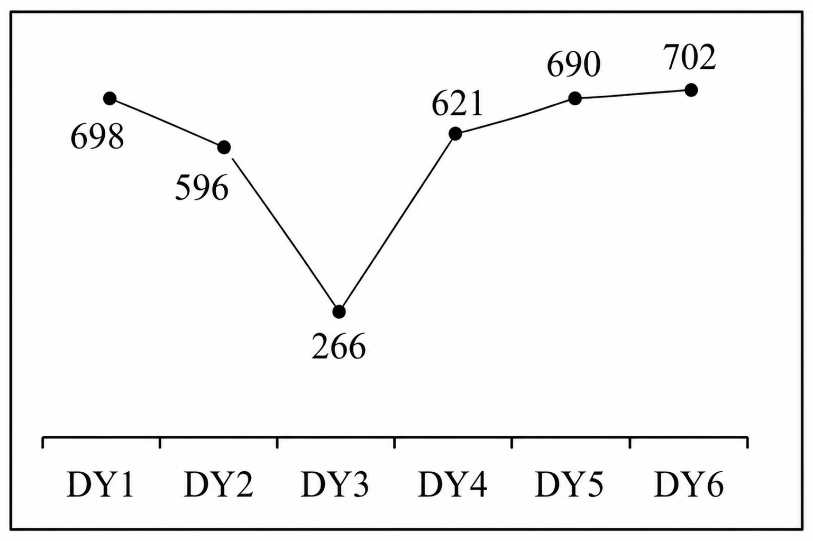
What is the average number of calories burnt by the person each day in the given 6 days?
The line chart given below shows the monthly petrol consumption (in litres) by 6 different cars CR1, CR2, CR3, CR4, CR5 and CR6.
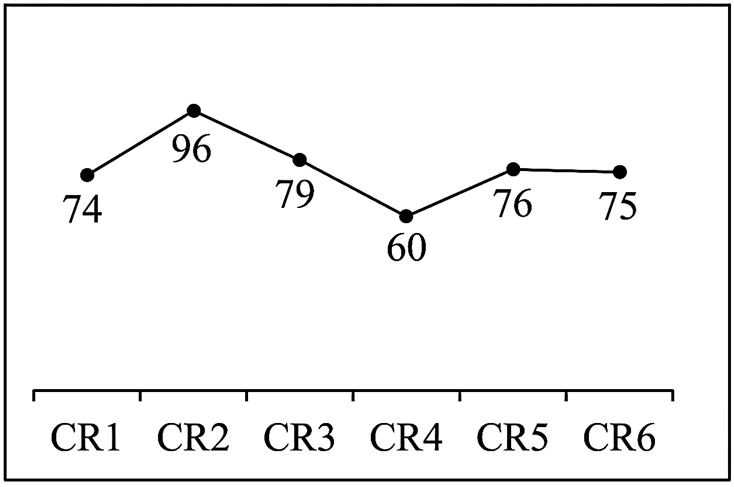
What is the average monthly consumption (in litres) of petrol per car for these 6 cars?
The line chart given below shows the number of tickets sold (in '000) for 5 cricket matches TM1, TM2, TM3, TM4 and TM5.
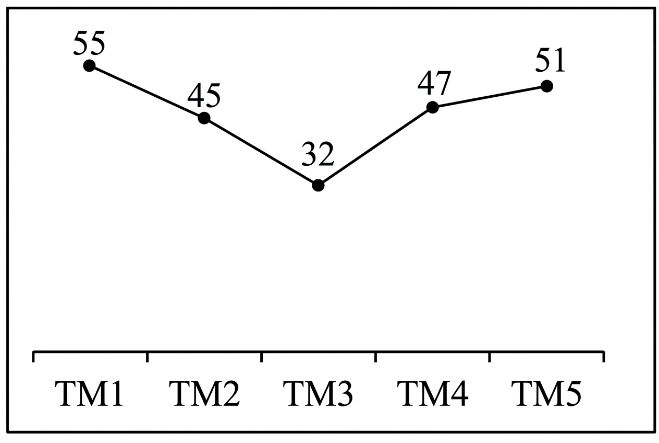
For the given 5 matches, what is the average number of tickets sold per match?
The line chart given below shows the average marks obtained by each student of 6 classes C1, C2, C3, C4, C5 and C6 in a school.
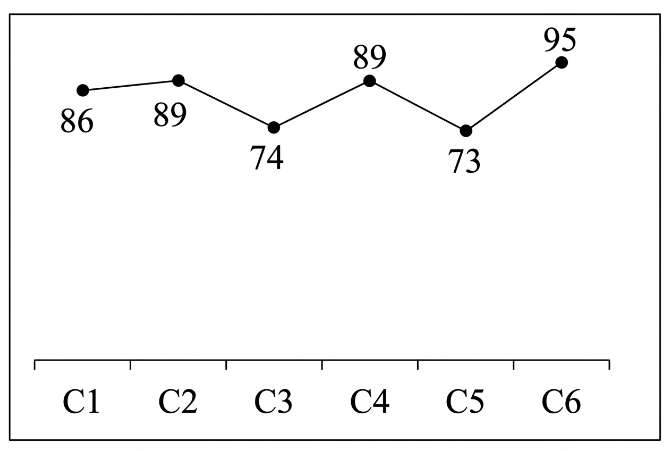
Average marks of each students of which class is 100% of the average marks of each student of class C2?
The line chart given below shows the number of followers (in '000) on Instagram of a person in 6 consecutive months MT1, MT2, MT3, MT4, MTS and MT6.
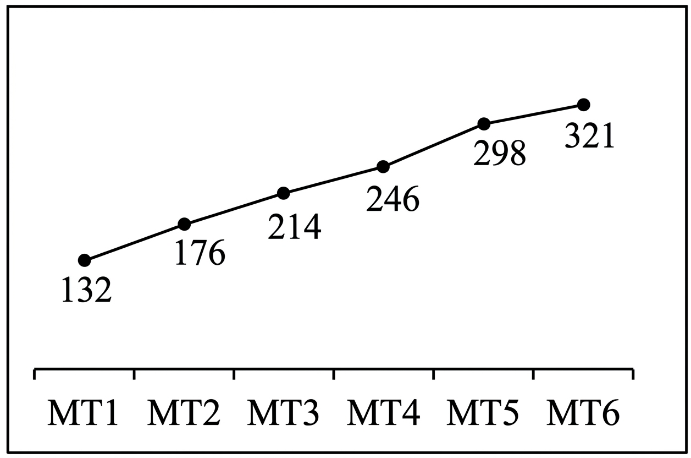
What is the average monthly increase in the number of followers of the person on the Instagram from MT1 to MT6?
The line chart given below shows the sales of 5 items 11, 12, 13, 14 and 15 in a month.
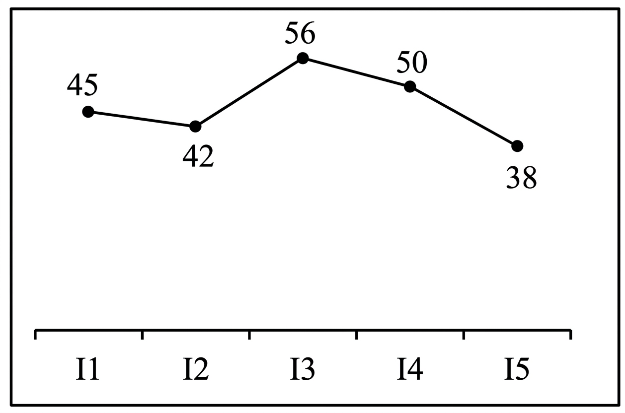
Sales of I4 are what percent of total sales of these 5 items?
A line graph is given below which shows the number of cars sold by seller A and seller B on five days.
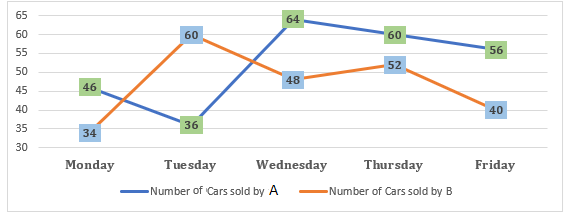
Find the number of cars sold on Sunday by A and B together. if number of cars sold on Sunday is 16 percent more than the cars sold on Friday by A and B together?
The graph shows number of visitors (ladies and gents) in four different museums namely 1, 2, 3 and 4.
Which museum had the maximum number of visitors?
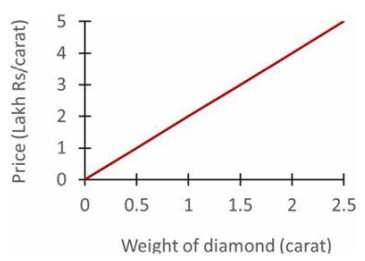
The diagram shows the rate of diamonds of different sizes. Of what size is the largest diamond that can be purchased for Rs.4.5 lakh?
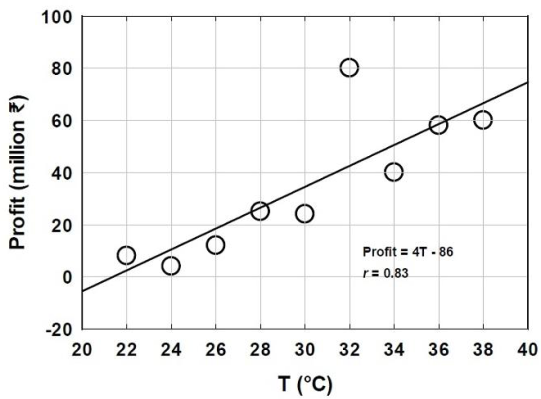
The given figure shows a line fit using least squares method between profit in chocolate business and mean temperature (T) data for a city. The correlation coefficient obtained from this data is r. Which one of the following statements is INCORRECT?


Suggested Test Series

Suggested Test Series
The line chart given below shows the number of calories burnt by a person on 6 consecutive days DY1, DY2, DY3, DY4, DY5 and DY6.
What is the average number of calories burnt by the person each day in the given 6 days?
The line chart given below shows the monthly petrol consumption (in litres) by 6 different cars CR1, CR2, CR3, CR4, CR5 and CR6.
What is the average monthly consumption (in litres) of petrol per car for these 6 cars?
The line chart given below shows the number of tickets sold (in '000) for 5 cricket matches TM1, TM2, TM3, TM4 and TM5.
For the given 5 matches, what is the average number of tickets sold per match?
The line chart given below shows the average marks obtained by each student of 6 classes C1, C2, C3, C4, C5 and C6 in a school.
Average marks of each students of which class is 100% of the average marks of each student of class C2?
The line chart given below shows the number of followers (in '000) on Instagram of a person in 6 consecutive months MT1, MT2, MT3, MT4, MTS and MT6.
What is the average monthly increase in the number of followers of the person on the Instagram from MT1 to MT6?
The line chart given below shows the sales of 5 items 11, 12, 13, 14 and 15 in a month.
Sales of I4 are what percent of total sales of these 5 items?
A line graph is given below which shows the number of cars sold by seller A and seller B on five days.
Find the number of cars sold on Sunday by A and B together. if number of cars sold on Sunday is 16 percent more than the cars sold on Friday by A and B together?
The graph shows number of visitors (ladies and gents) in four different museums namely 1, 2, 3 and 4.
Which museum had the maximum number of visitors?
The diagram shows the rate of diamonds of different sizes. Of what size is the largest diamond that can be purchased for Rs.4.5 lakh?
The given figure shows a line fit using least squares method between profit in chocolate business and mean temperature (T) data for a city. The correlation coefficient obtained from this data is r. Which one of the following statements is INCORRECT?