Correct option is C
Given:
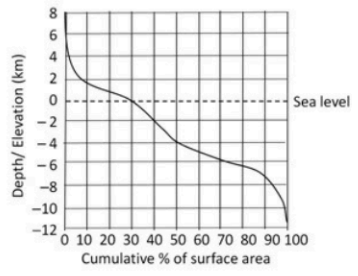
- A hypsographic graph:
- Shows % of Earth's surface at or above/below various elevations.
- Most of the Earth's surface lies below sea level (oceans).
- Land area mostly lies below 2 km elevation.
- Ocean floors mostly lie between 0 and -4 km, with steep drop-off after that.
- Deepest point in oceans (~ -11 km) is greater in depth than the height of Mount Everest (~ +8.8 km).
Graph Interpretation Highlights:
- Sea level (0 km) aligns with ~29–30% of the cumulative surface area → ~70% of Earth's surface lies below sea level.
- From 0 to 2 km elevation: majority of the land surface is here (about 25% of Earth's surface).
- From 0 to -4 km depth: less than half of the area below sea level.
- From -4 km to -11 km: major ocean basin → this is a significant chunk (about 40%).
Let’s evaluate each option:
A. Larger proportion of the surface of the Earth is below sea-level
→ True
Graph shows ~70% of surface area lies below 0 km.
B. Of the surface area above sea-level, larger proportion lies below 2 km elevation
→ True
Most land lies between 0 and 2 km elevation.
C. Of the surface area below sea-level, smaller proportion lies below 4 km depth
→ False
From the graph, the majority of the ocean floor lies below -4 km → especially between -4 and -6 km. So this is clearly false.
D. Distance from sea-level to maximum depth is greater than that to the maximum elevation
→ True
- Mariana Trench: ~ -11 km
- Mount Everest: ~ +8.8 km
→ Depth is greater.
Correct Answer (False Statement): (C)