arrow
arrow
arrow
The given chart represents the import of various consumer goods (in Lakh tons) during the years 2016-2020.What is the ratio of the number of cosmetics
Question

The given chart represents the import of various consumer goods (in Lakh tons) during the years 2016-2020.

What is the ratio of the number of cosmetics imported in years 2016 and 2020 together to that of toys in the year 2018 and 2020 together?

A.

7 : 6

B.

5 : 2

C.

4 : 3

D.

3 : 1

Correct option is C

Solution:

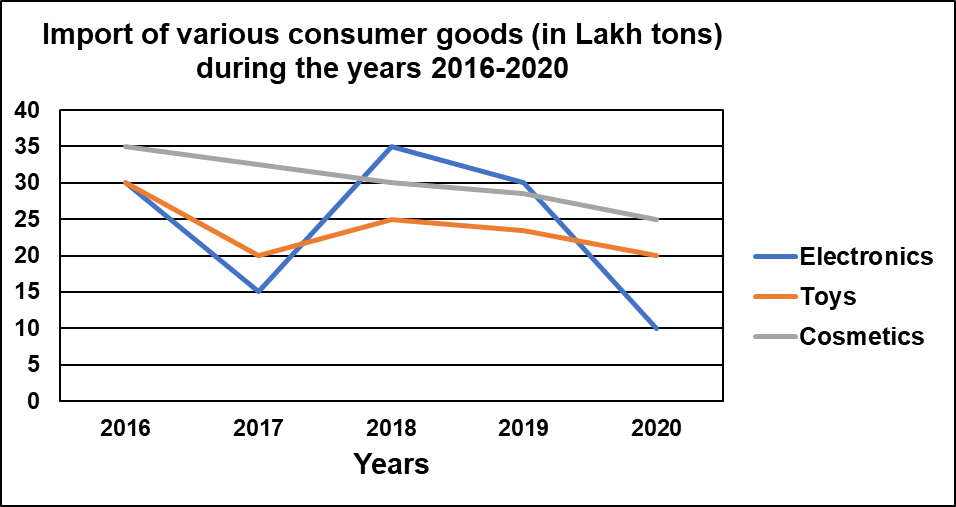
Extract data from the chart.
- Cosmetics in 2016 = 35 lakh tons
- Cosmetics in 2020 = 25 lakh tons
- Toys in 2018 = 25 lakh tons
- Toys in 2020 = 20 lakh tons
Calculate the sum for cosmetics in 2016 and 2020.
Sum (Cosmetics) = 35 + 25 = 60 lakh tons
Calculate the sum for toys in 2018 and 2020.
Sum (Toys) = 25 + 20 = 45 lakh tons
Find the ratio.
Ratio = Sum (Cosmetics) : Sum (Toys) = 60 : 45 = 4 : 3 

Free Tests

Free
Must Attempt

CBT-1 Full Mock Test 1

languageIcon English
  • pdpQsnIcon100 Questions
  • pdpsheetsIcon100 Marks
  • timerIcon90 Mins
languageIcon English
Free
Must Attempt

RRB NTPC Graduate Level PYP (Held on 5 Jun 2025 S1)

languageIcon English
  • pdpQsnIcon100 Questions
  • pdpsheetsIcon100 Marks
  • timerIcon90 Mins
languageIcon English
Free
Must Attempt

CBT-1 General Awareness Section Test 1

languageIcon English
  • pdpQsnIcon40 Questions
  • pdpsheetsIcon30 Marks
  • timerIcon25 Mins
languageIcon English

Similar Questions

test-prime-package

Access ‘RRB NTPC CBT-2’ Mock Tests with

  • 60000+ Mocks and Previous Year Papers
  • Unlimited Re-Attempts
  • Personalised Report Card
  • 500% Refund on Final Selection
  • Largest Community
students-icon
354k+ students have already unlocked exclusive benefits with Test Prime!
Our Plans
Monthsup-arrow