Correct option is B
Required ratio = 300+180: 400 = 120:100 = 6:5


The line graph given below shows the total students four college and it also shows the student visual Art department. Read the data carefully and answer the questions given below.
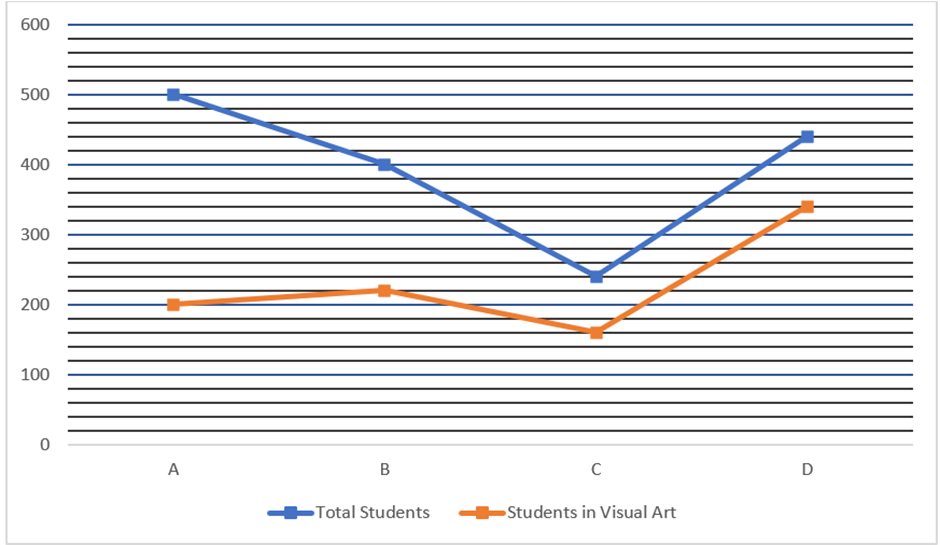
Find the ratio of student who are in Fine Art in college A and B together to total student in B?
Required ratio = 300+180: 400 = 120:100 = 6:5
Total number of students who are in Visual Arts in B is what percentage of total student in college D?
Required percentage =
In college F, the ratio of student who are in Visual Art and Fine Art is 3:5 and the difference between student who are in Visual Art and Fine Art in F is equal to total student in B. Find the students who are in Visual Art in F?
Let the student who are in Visual Art and Fine Art is 3x and 5x.
ATQ,
5x – 3x = 400
2x = 400
200 = x
Required answer = 3x = 600
Find the average number of students in all the given colleges?
Required average =
Find a difference between students in Fine Art in C and D together and who are in Visual Art in A and B together?
Required difference =(200+220) -(80+100) = 240
 English
 35 Questions
 35 Marks
 20 Mins English English35 Questions35 Marks20 Mins English English150 Questions150 Marks105 Mins English
A line graph is given below which shows the number of cars sold by seller A and seller B on five days.

Find the number of cars sold on Sunday by A and B together. if number of cars sold on Sunday is 16 percent more than the cars sold on Friday by A and B together?
The graph shows number of visitors (ladies and gents) in four different museums namely 1, 2, 3 and 4.
Which museum had the maximum number of visitors?

The diagram shows the rate of diamonds of different sizes. Of what size is the largest diamond that can be purchased for Rs.4.5 lakh?

The given figure shows a line fit using least squares method between profit in chocolate business and mean temperature (T) data for a city. The correlation coefficient obtained from this data is r. Which one of the following statements is INCORRECT?

Time-distance graph of two objects A and B are shown.
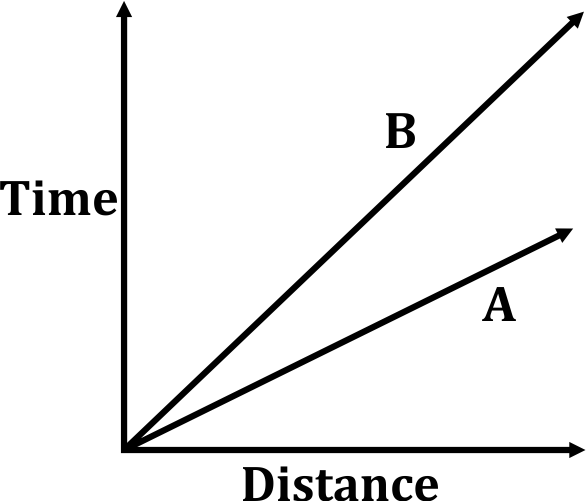
If the axes are interchanged, then the same information is shown by
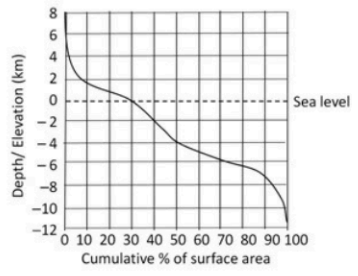
Based on the distribution of the cumulative percent surface area of the Earth at different elevations and depths (with reference to sea-level) shown in the figure, which of the following is FALSE?
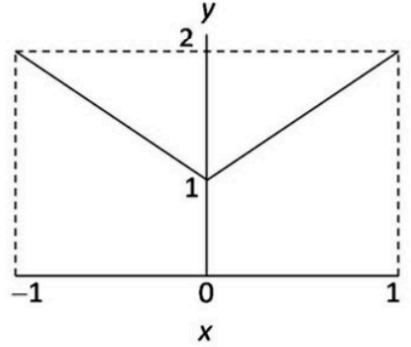
What is the average value of y for the range of x shown in the following plot?
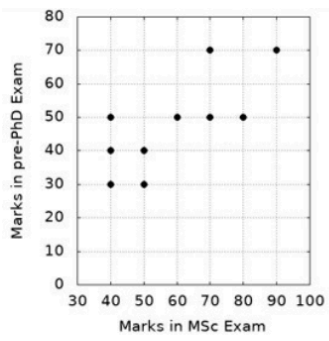
Pre-Ph.D. exam score of 10 students are plotted against their M.Sc. marks. Which ofthe following is true?
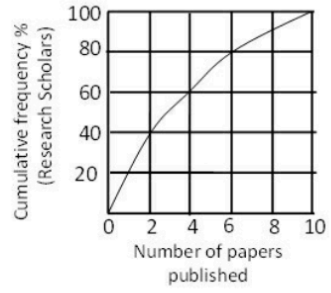
The graph shows cumulative frequency percentage of research scholars and the number of papers published by them. Which of the following statements is true?
The given chart represents the import of various consumer goods (in Lakh tons) during the years 2016-2020.
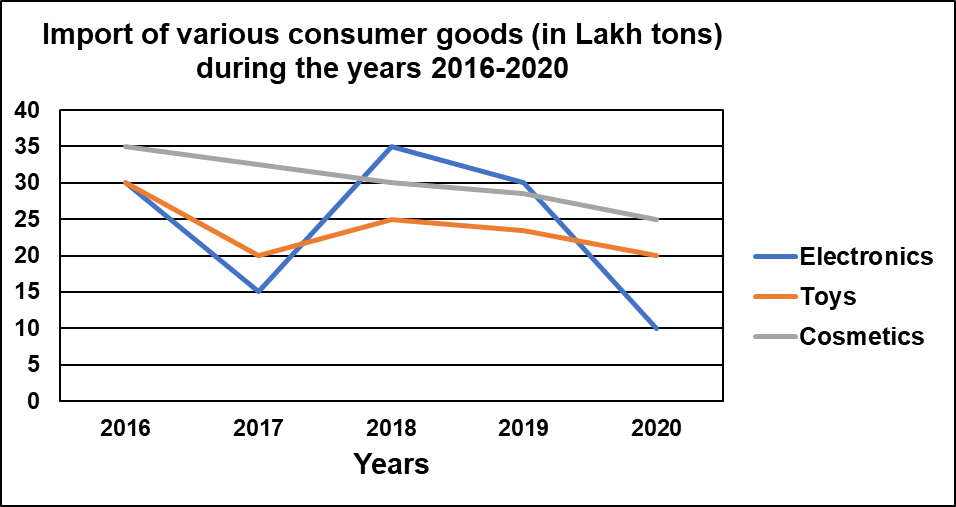
What is the ratio of the number of cosmetics imported in years 2016 and 2020 together to that of toys in the year 2018 and 2020 together?

Suggested Test Series

Suggested Test Series