Correct option is C
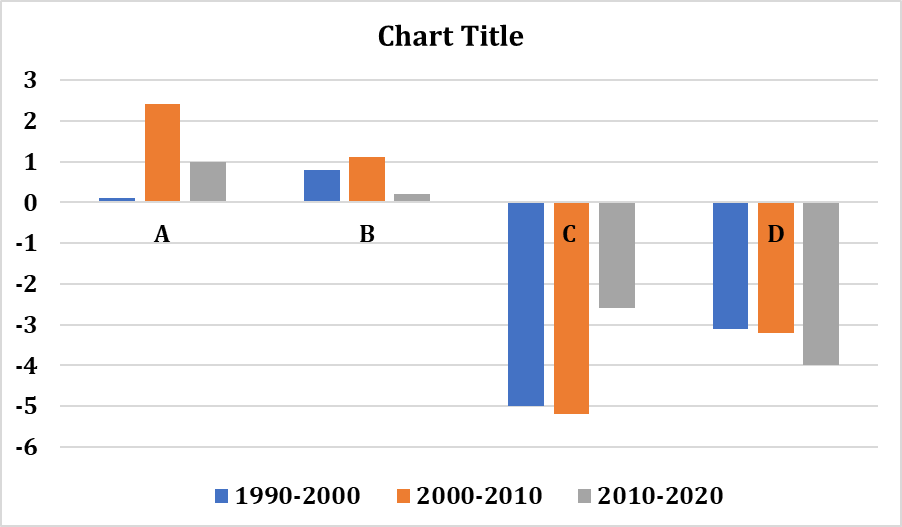
To identify the correct regions (A–D) based on the net change in forest cover from 1990 to 2020, let's analyze the graph:
- Region A (Positive Change)
- The bars are above the zero line, indicating a net gain in forest cover.
- This is characteristic of Asia, where afforestation and reforestation projects (especially in China and India) have led to forest expansion.
- Region B (Slight Positive/Stable Change)
- The net forest cover change is small and positive.
- This pattern matches Europe, where sustainable forest management and conservation efforts have led to stable or increasing forest areas.
- Region C (Significant Negative Change)
- The graph shows a major loss of forest cover, though less severe than Region D.
- This corresponds to South America, where deforestation, especially in the Amazon rainforest, has led to large-scale forest loss.
- Region D (Most Severe Negative Change)
- The highest rate of forest loss is observed here.
- This matches Africa, where deforestation due to agriculture, logging, and fuelwood collection has been severe.