Correct option is A
Explanation-
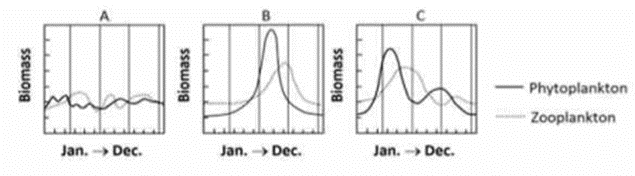
Graph A: Shows relatively stable, low levels of both phytoplankton and zooplankton throughout the year.
→ This pattern is typical of tropical oceans, where sunlight is abundant year-round but stratification limits nutrient availability.
Graph B: Shows a sharp single peak during mid-year, suggesting a strong seasonal change.
→ This fits polar oceans, where long winters limit production, and there is a strong bloom during summer due to 24-hour daylight and nutrient upwelling.
Graph C: Shows two peaks in phytoplankton biomass (spring and fall), typical of temperate oceans, which have seasonal mixing and light variation that allow for two bloom periods.
Matching:
A → i (Tropical oceans)
B → ii (Polar oceans)
C → iii (Temperate oceans)
Correct Answer is -
Option a: A-i, B-ii, C-iii