Correct option is C
Solution:
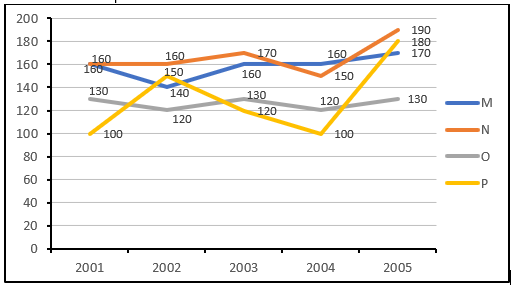
The following data represents the rainfall (in centimeters) for cities M, N, O, and P from 2001 to 2005:
M: 160, 140, 160, 160, 170
N: 160, 160, 170, 150, 190
O: 130, 120, 130, 120, 130
P: 100, 150, 120, 100, 180
To find the city with the maximum average rainfall, we calculate the average rainfall for each city as follows:
Average rainfall for M = (160 +140+160 +160 +170) / 5
= 158 cm
Average rainfall for N = (160+ 160+170+ 150+190) / 5
= 166 cm
Average rainfall for O = (130 +120 + 130 + 120 +130) / 5
= 126 cm
Average rainfall for P = (100 +150 +120 + 100 + 180) / 5
= 130 cm
According to the calculating data we get that the annual average rainfall is closest in O and P state.
 English
 100 Questions
 100 Marks
 90 Mins