Correct option is D
Solution:
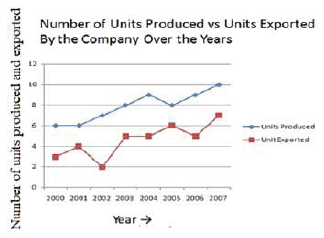
According to graph :
Year | Produced | Exported |
2000 - 2001 | 6 | 4 |
2001 - 2002 | 7 | 2 |
2002 - 2003 | 8 | 5 |
2003 - 2004 | 9 | 5 |
2004 - 2005 | 8 | 6 |
2005 - 2006 | 9 | 5 |
2006 - 2007 | 10 | 7 |
The units produced decline : 2004 - 2005.
The correct answer is option (d) 2004 - 2005
 English
 100 Questions
 100 Marks
 90 Mins