Correct option is A
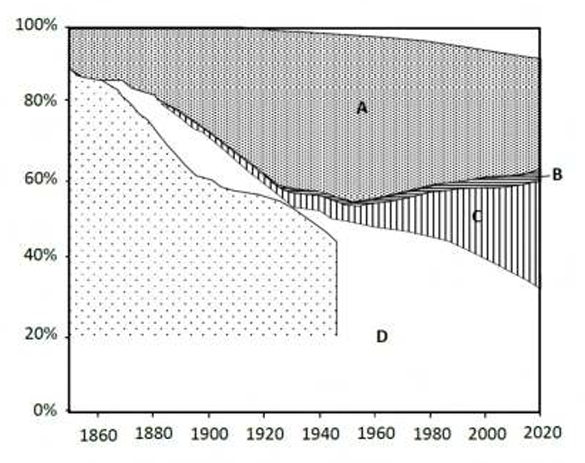
Based on the cumulative fossil CO₂ emissions from 1850 to 2020:
- A (North America) shows a dominant share in emissions, especially in the early part of the timeline, which is consistent with the historical industrial emissions from North America.
- B (Africa), which has relatively low emissions, is correctly identified by the pattern where it consistently remains at a lower level compared to other continents.
- C (Asia) shows an increase in emissions especially after the 1950s, matching the pattern of rapid industrialization in countries like China and India, making Asia the best fit for C.
- D (Europe) has a significant but declining share of emissions, particularly after 1950, consistent with Europe’s reduction in coal and other fossil fuels use and its shift towards cleaner energy sources.
Information Booster:
- Cumulative CO₂ emissions reflect the total carbon emissions over time, showing long-term trends in energy use and industrial development across different continents.
- North America was historically the largest emitter of fossil CO₂, primarily due to industrialization during the 19th and early 20th centuries.
- Asia has seen rapid growth in emissions, especially post-1950, due to the industrialization of countries like China and India.
- Europe's emissions have declined due to a shift towards cleaner energy and stronger environmental regulations.
- Africa remains with relatively low emissions in comparison to other continents due to slower industrialization and energy demands.