Correct option is D
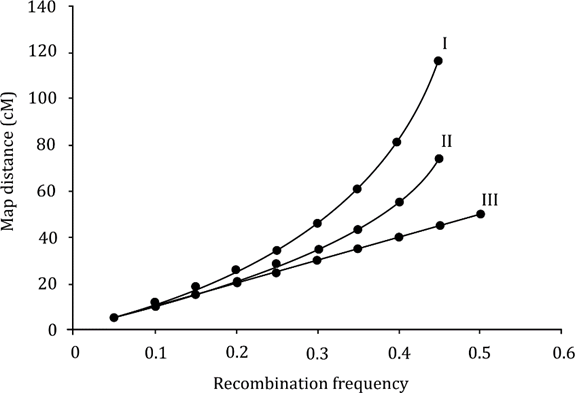
A. Line I in the above plot represents relationship based on Kosambi function.
False. Line I shows the least correction, which corresponds to Sturtevant’s original mapping (no correction). Kosambi’s function (moderate correction) is Line II.
B. The chance of underestimation of map distance increases with increase in recombination frequency.
True. At higher recombination frequencies, double crossovers are more likely, and simple mapping (like Sturtevant’s) underestimates the true distance.
C. Genetic mapping proposed by Sturtevant assumes complete interference.
True. Sturtevant assumed no double crossovers, implying complete interference (i.e., one crossover prevents another nearby).
So, the correct option (d) F, T, T.