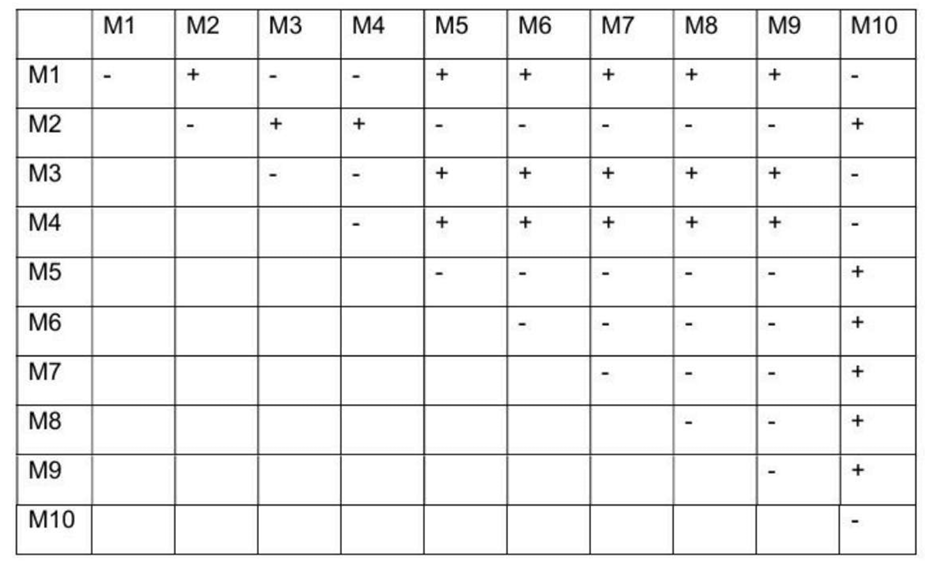
hamburger menu
All Coursesall course arrow
adda247
reward-icon
adda247
    arrow
    arrow
    arrow
    Given below are different types of mapping populations in plants (Column X) and their characteristic features (Column Y). Column X A. F₂ mapping
    Question

    Given below are different types of mapping populations in plants (Column X) and their characteristic features (Column Y).
    Column X
    A. F₂ mapping population
    B. Backcross population
    C. RILs
    D. F₁DH
    Column Y
    i. 1:0 segregation ratio of dominant markers
    ii. 1:1 segregation ratio for both dominant and co-dominant markers
    iii. Recombination is represented only from the male source
    iv. 3:1 phenotypic segregation ratio of dominant markers
    Which one of the following options is the correct match between all terms of Column X and Column Y?

    A.

    A–iv, B–i, C–ii, D–iii

    B.

    A–ii, B–iii, C–i, D–iv

    C.

    A–i, B–ii, C–iv, D–iii

    D.

    A–iii, B–iv, C–ii, D–i

    Correct option is A

    Correct Answer:
    (a) A–iv, B–i, C–ii, D–iii
    Explanation:
    An F₂ population shows Mendelian segregation, giving a 3:1 phenotypic ratio for dominant markers (A–iv).
    A backcross population exhibits a 1:0 segregation for dominant markers since one allele is fixed from the recurrent parent (B–i).
    Recombinant Inbred Lines (RILs) are homozygous and show a 1:1 segregation for both dominant and co-dominant markers (C–ii).
    In F₁-derived doubled haploids (F₁DH), recombination occurs during meiosis of the F₁ hybrid and is captured from the male gametic source (D–iii).
    Information Booster :
    · Mapping populations differ in heterozygosity and recombination history.
    · RILs provide high mapping resolution due to accumulated recombination.
    · Backcross populations are simple but offer limited recombination events.
    · Doubled haploids rapidly achieve complete homozygosity.
    Additional Information (Incorrect Options):
    A–ii / A–i / A–iii: F₂ populations do not show 1:1 or fixed segregation, nor male-only recombination.
    B–ii / B–iii / B–iv: Backcross populations do not show equal segregation for co-dominant markers or 3:1 ratios.
    C–i / C–iv: RILs do not show fixed (1:0) or 3:1 segregation patterns.
    D–i / D–iv / D–ii: F₁DH lines are fixed lines and do not show Mendelian segregation ratios.

    Similar Questions

    test-prime-package

    Access ‘CSIR NET Life Sciences’ Mock Tests with

    • 60000+ Mocks and Previous Year Papers
    • Unlimited Re-Attempts
    • Personalised Report Card
    • 500% Refund on Final Selection
    • Largest Community
    students-icon
    368k+ students have already unlocked exclusive benefits with Test Prime!
    Our Plans
    Monthsup-arrow