arrow
arrow
arrow
Study the given graph and answer the question that follows.The graph presents total number of students who opted for different subjects in a college.W
Question

Study the given graph and answer the question that follows.

The graph presents total number of students who opted for different subjects in a college.

What is the difference between the total number of student who have opted for ‘Biology and Mathematics’ & total number of students who have opted for ‘Civics and History"?

A.

50

B.

52

C.

49

D.

51

Correct option is D

Given:

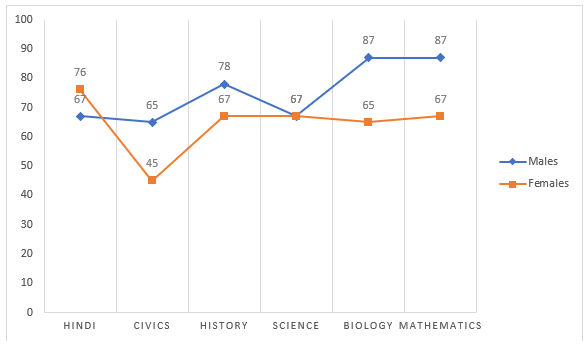
The total number of students who opted for different subjects in a college

Solution:

The total number of students opted for ‘Biology and Mathematics’ = [(65+87) + (67+87)] = 306

The total number of students opted for ‘Civics and History’ = [(45+65)+(67+78)] = 255

Difference = 306 -255 = 51

Free Tests

Free
Must Attempt

CBT-1 Full Mock Test 1

languageIcon English
  • pdpQsnIcon100 Questions
  • pdpsheetsIcon100 Marks
  • timerIcon90 Mins
languageIcon English
Free
Must Attempt

RRB NTPC Graduate Level PYP (Held on 5 Jun 2025 S1)

languageIcon English
  • pdpQsnIcon100 Questions
  • pdpsheetsIcon100 Marks
  • timerIcon90 Mins
languageIcon English
Free
Must Attempt

CBT-1 General Awareness Section Test 1

languageIcon English
  • pdpQsnIcon40 Questions
  • pdpsheetsIcon30 Marks
  • timerIcon25 Mins
languageIcon English
test-prime-package

Access ‘RRB Group D’ Mock Tests with

  • 60000+ Mocks and Previous Year Papers
  • Unlimited Re-Attempts
  • Personalised Report Card
  • 500% Refund on Final Selection
  • Largest Community
students-icon
353k+ students have already unlocked exclusive benefits with Test Prime!
Our Plans
Monthsup-arrow