arrow
arrow
arrow
Study the given chart and answer the question that follows.The numbers 1 to 6 represent the years from 2001 to 2006What is the average number of vehic
Question

Study the given chart and answer the question that follows.

The numbers 1 to 6 represent the years from 2001 to 2006

What is the average number of vehicles (approx.) manufactured by company B over the given period?

A.

1,19,333​

B.

1,11,223

C.

1,22,778

D.

1,23,666

Correct option is A

Given:

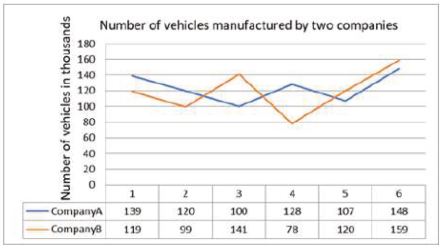
Number of vehicles manufactured by company A and B from the year 2001 to 2006

Formula Used:

Average =Sum of observationsNumber of observations= \frac{Sum\ of \ observations}{Number\ of \ observations}​​

Solution:

Vehicles manufactured by company B from year 2001 to 2006 are

= 119,99,141,78,120,159

Total sum of vehicles manufactured = 119+99+141+78+120+159 = 716

Average =7166 \frac{716}{6}​ = 119.333 thousands

= 1,19,333

Free Tests

Free
Must Attempt

CBT-1 Full Mock Test 1

languageIcon English
  • pdpQsnIcon100 Questions
  • pdpsheetsIcon100 Marks
  • timerIcon90 Mins
languageIcon English
Free
Must Attempt

RRB NTPC Graduate Level PYP (Held on 5 Jun 2025 S1)

languageIcon English
  • pdpQsnIcon100 Questions
  • pdpsheetsIcon100 Marks
  • timerIcon90 Mins
languageIcon English
Free
Must Attempt

CBT-1 General Awareness Section Test 1

languageIcon English
  • pdpQsnIcon40 Questions
  • pdpsheetsIcon30 Marks
  • timerIcon25 Mins
languageIcon English

Similar Questions

test-prime-package

Access ‘RRB Group D’ Mock Tests with

  • 60000+ Mocks and Previous Year Papers
  • Unlimited Re-Attempts
  • Personalised Report Card
  • 500% Refund on Final Selection
  • Largest Community
students-icon
353k+ students have already unlocked exclusive benefits with Test Prime!
Our Plans
Monthsup-arrow