arrow
arrow
arrow
Study the following graph carefully and answer the question. For company A, what is the approximate percentage decrease in production from 2015 to 2
Question

Study the following graph carefully and answer the question.
For company A, what is the approximate percentage decrease in production from 2015 to 2016?  

A.

15%

B.

22%

C.

25%

D.

20%

Correct option is A

Given: 
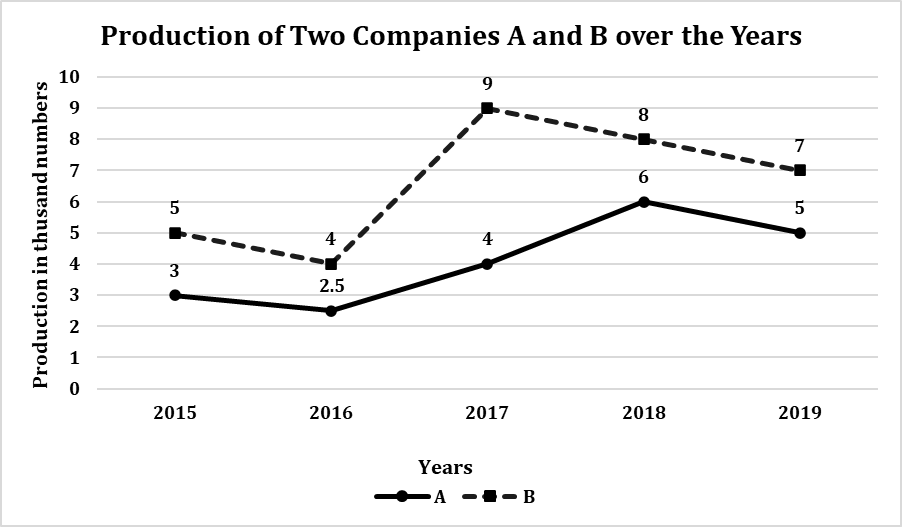
Production in 2015 by P = 3 thousands 
Production in 2016 by P = 2.5 thousand  
Solution: 
Decrease in production = 3 - 2.5 = 0.5 thousands
Decrease % = 0.53×100=503=16.66%\frac{0.5}{3}\times100 = \frac{50}{3} = 16.66\% 
From the options, 
Option (a) 15% is the nearest to the 16.66%. 
Thus, option(a) is correct.

Free Tests

Free
Must Attempt

CBT-1 Full Mock Test 1

languageIcon English
  • pdpQsnIcon100 Questions
  • pdpsheetsIcon100 Marks
  • timerIcon90 Mins
languageIcon English
Free
Must Attempt

RRB NTPC Graduate Level PYP (Held on 5 Jun 2025 S1)

languageIcon English
  • pdpQsnIcon100 Questions
  • pdpsheetsIcon100 Marks
  • timerIcon90 Mins
languageIcon English
Free
Must Attempt

RRB NTPC UG Level PYP (Held on 7 Aug 2025 S1)

languageIcon English
  • pdpQsnIcon100 Questions
  • pdpsheetsIcon100 Marks
  • timerIcon90 Mins
languageIcon English

Similar Questions

test-prime-package

Access ‘RRB Group D’ Mock Tests with

  • 60000+ Mocks and Previous Year Papers
  • Unlimited Re-Attempts
  • Personalised Report Card
  • 500% Refund on Final Selection
  • Largest Community
students-icon
368k+ students have already unlocked exclusive benefits with Test Prime!
Our Plans
Monthsup-arrow