Correct option is D
Given:
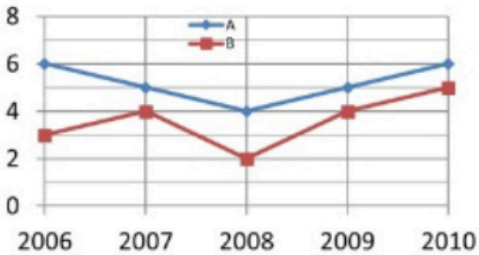
The graph shows income (in lakhs) of persons A and B from 2006 to 2010.
We need to identify the true statement based on the graph.
Formula Used:
Solution:
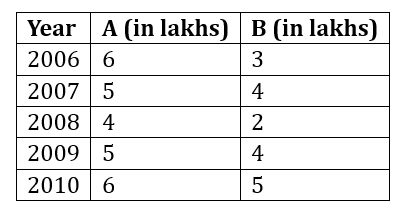
Step 1: Read data from graph
Approximate yearly incomes:
Step 2: Find Average Incomes
Total income of A = 6 + 5 + 4 + 5 + 6 = 26
Average income of A = 26 / 5 = 5.2 lakhs
Total income of B = 3 + 4 + 2 + 4 + 5 = 18
Average income of B = 18 / 5 = 3.6 lakhs
Difference in averages = 5.2 − 3.6 = 1.6 lakhs
So, Option (c) is close, but it says 1.8, so we must reject it as incorrect.
Let’s now verify all options one by one.
Option (a):
Over the years, trends of income of A and B are the same.
Check trend:
A: 6→5→4→5→6
B: 3→4→2→4→5
Different trends. So, False
Option (b):
The largest difference in incomes of A and B is in the year 2008.
In 2008: A = 4, B = 2 → Difference = 2
In 2006: A = 6, B = 3 → Difference = 3 (larger)
So, False
Option (c):
Average income of A is higher by 1.8 lakh compared to B.
We found difference is 1.6, not 1.8 → False
Option (d):
During the given period, the annual income of A was below its average more than twice.
Average of A = 5.2
A’s values: 6, 5, 4, 5, 6
Values below average = 5, 4, 5 → 3 times
So, True
Final Answer: (d) During the given period, the annual income of A was below its average more than twice.