Correct option is B
The Shannon index measures the diversity in a community by considering both species richness (number of species) and evenness (distribution of individuals among species). The formula is:
Where:
is the Shannon index,
is the proportion of individuals in the iii-th species.
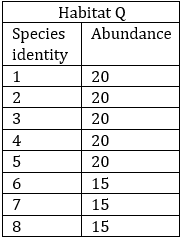
Given that there are 20 species with almost equal abundance, the proportion for each species, is .
Using this proportion, the Shannon index is calculated as:
The natural logarithm of 120\frac{1}{20} is approximately and when multiplied by , the value is approximately
−0.149785-0.149785−0.149785.
Since there are 20 species, the Shannon index is:
Thus, the Shannon index of diversity is approximately 3.0.
Information Booster:
Shannon index quantifies both the number of species and how evenly individuals are distributed among those species.
When species are evenly distributed, the Shannon index reaches higher values, indicating greater diversity.
20 species in almost equal abundance result in a higher Shannon index of around 3.0, which reflects a highly diverse community.
The Shannon index can be used to compare diversity between different communities or environments.
A higher Shannon index suggests more balanced species distribution and richer biodiversity.
Additional Information:
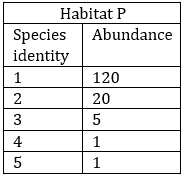
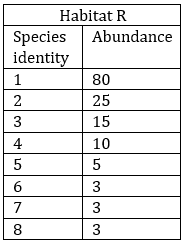
Option 1 (2.0): This would suggest a lower diversity, often reflecting fewer species or uneven abundance among species.
Option 3 (0.5): Indicates very low diversity, typically seen in communities where one or few species dominate.
Option 4 (1.0): Indicates a modest diversity, but not as high as 3.0, implying a less even distribution of species.