arrow
arrow
arrow
At a polling booth polling starts at 6 AM. Which of the given graphs CANNOT depict cumulative voting percentage (of the total voters enrolled) against
Question

At a polling booth polling starts at 6 AM. Which of the given graphs CANNOT depict cumulative voting percentage (of the total voters enrolled) against time?

A.

A

B.

B​​

C.

C

D.

D

Correct option is C

Solution:

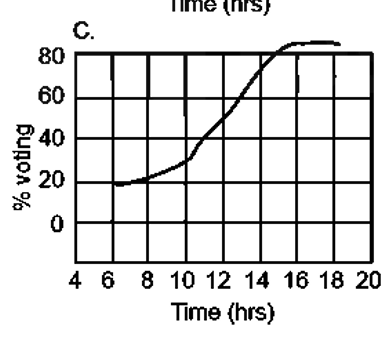
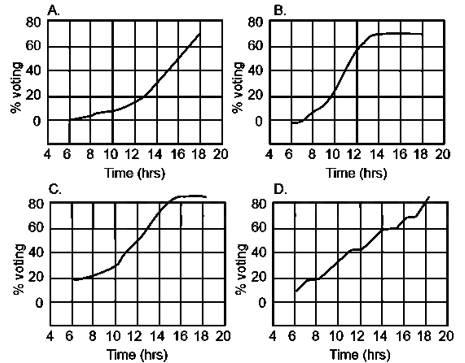
​Time range: 4 AM to 8 PM.

Voting % starts increasing from before 6 AM — around 5 AM, the % voting begins rising from 0.

That means some votes are shown as cast before 6 AM, which violates the given condition.

Why Graph C is Incorrect:
The question clearly states polling starts at 6 AM.

Cumulative % voting cannot begin before 6 AM, yet in this graph, it clearly does.

This makes Graph C logically invalid.

Similar Questions

test-prime-package

Access ‘CSIR NET- GENERAL APTITUDE’ Mock Tests with

  • 60000+ Mocks and Previous Year Papers
  • Unlimited Re-Attempts
  • Personalised Report Card
  • 500% Refund on Final Selection
  • Largest Community
students-icon
354k+ students have already unlocked exclusive benefits with Test Prime!
Our Plans
Monthsup-arrow