
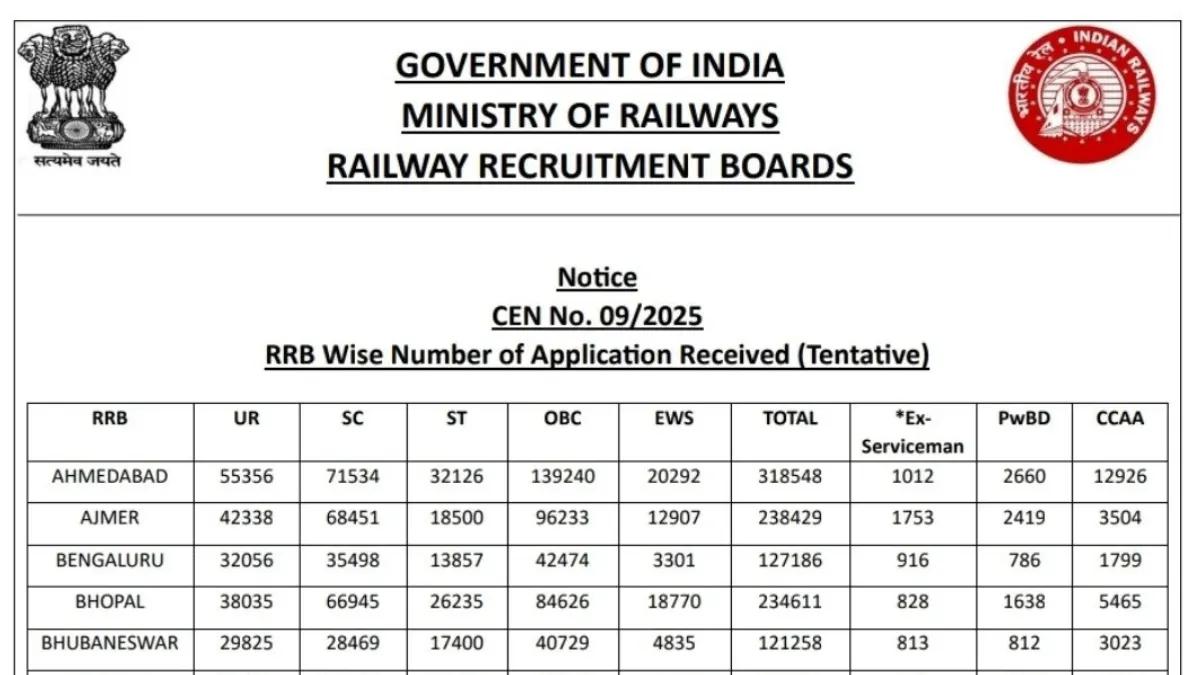
The Railway Recruitment Boards (RRBs) have received a total of 52,39,760 applications for RRB Group D 2026. Candidates who applied for the Level 1 posts can check the complete RRB Group D applications received zone-wise in this article.
RRB Group D Total Applications Received 2026
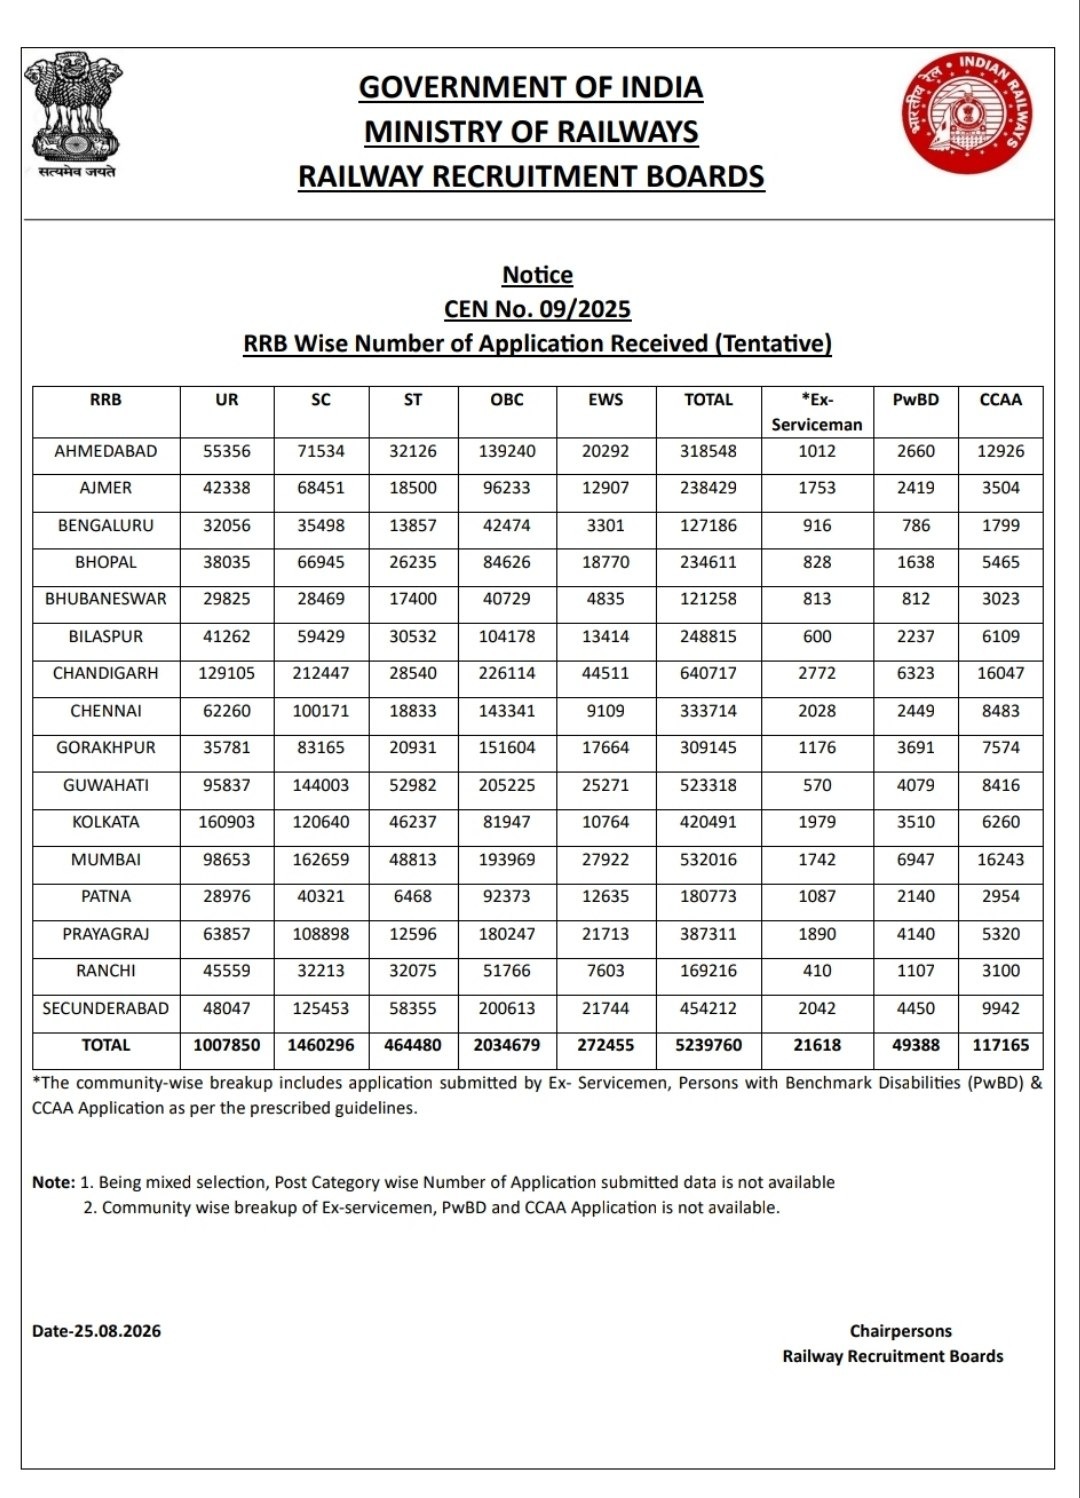
As per the zone-wise application data, 52.39 lakh candidates have applied for RRB Group D 2026. Among the 16 RRB zones, Chandigarh received the maximum applications, followed by Mumbai and Guwahati.
The category-wise application data shows that OBC candidates submitted the highest number of applications with 20,34,679 applications, followed by SC candidates with 14,60,296 applications and UR candidates with 10,07,850 applications.
RRB Group D Total Applications Received 2026: Key Highlights
| Particular | Details |
| Recruitment |
RRB Group D 2026
|
| Post Level | Level 1 |
| Total Applications | 52,39,760 |
| RRB Zones | 16 |
| Highest Applications | Chandigarh |
| Highest Zone-wise Applications | 6,40,717 |
| Lowest Applications | Bhubaneswar |
| Lowest Zone-wise Applications | 1,21,258 |
| Highest Category-wise Applications | OBC |
| OBC Applications | 20,34,679 |
RRB Group D 2026 Applications: Category-wise
The data indicates strong participation across all categories, with OBC candidates accounting for the largest share of the total applications.
| Category | Applications Received |
| UR | 10,07,850 |
| SC | 14,60,296 |
| ST | 4,64,480 |
| OBC | 20,34,679 |
| EWS | 2,72,455 |
| Total | 52,39,760 |
RRB Group D 2026 Zone-wise Applications
The following table provides the complete RRB Group D total applications received zone-wise along with the category-wise breakup.
| RRB Zone | UR | SC | ST | OBC | EWS | Total Applications | Ex-Serviceman | PwBD | CCAA |
| Ahmedabad | 55,356 | 71,534 | 32,126 | 1,39,240 | 20,292 | 3,18,548 | 1,012 | 2,660 | 12,926 |
| Ajmer | 42,338 | 68,451 | 18,500 | 96,233 | 12,907 | 2,38,429 | 1,753 | 2,419 | 3,504 |
| Bengaluru | 32,056 | 35,498 | 13,857 | 42,474 | 3,301 | 1,27,186 | 916 | 786 | 1,799 |
| Bhopal | 38,035 | 66,945 | 26,235 | 84,626 | 18,770 | 2,34,611 | 828 | 1,638 | 5,465 |
| Bhubaneswar | 29,825 | 28,469 | 17,400 | 40,729 | 4,835 | 1,21,258 | 813 | 812 | 3,023 |
| Bilaspur | 41,262 | 59,429 | 30,532 | 1,04,178 | 13,414 | 2,48,815 | 600 | 2,237 | 6,109 |
| Chandigarh | 1,29,105 | 2,12,447 | 28,540 | 2,26,114 | 44,511 | 6,40,717 | 2,772 | 6,323 | 16,047 |
| Chennai | 62,260 | 1,00,171 | 18,833 | 1,43,341 | 9,109 | 3,33,714 | 2,028 | 2,449 | 8,483 |
| Gorakhpur | 35,781 | 83,165 | 20,931 | 1,51,604 | 17,664 | 3,09,145 | 1,176 | 3,691 | 7,574 |
| Guwahati | 95,837 | 1,44,003 | 52,982 | 2,05,225 | 25,271 | 5,23,318 | 570 | 4,079 | 8,416 |
| Kolkata | 1,60,903 | 1,20,640 | 46,237 | 81,947 | 10,764 | 4,20,491 | 1,979 | 3,510 | 6,260 |
| Mumbai | 98,653 | 1,62,659 | 48,813 | 1,93,969 | 27,922 | 5,32,016 | 1,742 | 6,947 | 16,243 |
| Patna | 28,976 | 40,321 | 6,468 | 92,373 | 12,635 | 1,80,773 | 1,087 | 2,140 | 2,954 |
| Prayagraj | 63,857 | 1,08,898 | 12,596 | 1,80,247 | 21,713 | 3,87,311 | 1,890 | 4,140 | 5,320 |
| Ranchi | 45,559 | 32,213 | 32,075 | 51,766 | 7,603 | 1,69,216 | 410 | 1,107 | 3,100 |
| Secunderabad | 48,047 | 1,25,453 | 58,355 | 2,00,613 | 21,744 | 4,54,212 | 2,042 | 4,450 | 9,942 |
| Total | 10,07,850 | 14,60,296 | 4,64,480 | 20,34,679 | 2,72,455 | 52,39,760 | 21,618 | 49,388 | 1,17,165 |
Which RRB Zone Received the Highest Applications?
The Chandigarh RRB received the highest number of applications, with 6,40,717 candidates applying for RRB Group D 2026. This makes Chandigarh the most preferred zone based on the number of applications received. The next highest application counts were recorded in:
- Mumbai: 5,32,016 applications
- Guwahati: 5,23,318 applications
- Secunderabad: 4,54,212 applications
- Kolkata: 4,20,491 applications
- Prayagraj: 3,87,311 applications
Top 5 RRB Zones by Number of Applications
| Rank | RRB Zone | Total Applications |
| 1 | Chandigarh | 6,40,717 |
| 2 | Mumbai | 5,32,016 |
| 3 | Guwahati | 5,23,318 |
| 4 | Secunderabad | 4,54,212 |
| 5 | Kolkata | 4,20,491 |
Bottom 5 RRB Zones by Applications
| Rank | RRB Zone | Total Applications |
| 1 | Bhubaneswar | 1,21,258 |
| 2 | Bengaluru | 1,27,186 |
| 3 | Ranchi | 1,69,216 |
| 4 | Patna | 1,80,773 |
| 5 | Bhopal | 2,34,611 |
What Does the RRB Group D Application Data Mean for Candidates?
The zone-wise application figures provide an indication of the overall applicant pool. Candidates should not assume that a zone with fewer applications will automatically have a lower cutoff, as the cutoff depends on several factors, including vacancies, candidate performance, difficulty level of the examination and normalization.
RRB Group D 2026 Competition
With 52,39,760 applications received across the 16 RRB zones, the competition for RRB Group D 2026 is expected to be intense. However, the number of applications alone does not determine the actual competition for a candidate because the number of vacancies varies from one zone to another.
Candidates should use this data to understand their competition level for the respective state. The application data can also help aspirants understand which RRB zones have attracted the highest number of candidates. It is important to adjust the preparation strategy accordingly and brace for tough competition.





 PSSSB Group D Answer Key 2026 Out at sss...
 UIIC AO Mains Admit Card 2026 for Phase ...
 MP SI Admit Card 2026 Out at esb.mp.gov....


 Adda247 Job portal has complete information about all Sarkari Jobs and Naukri Alerts, its latest recruitment notifications, from all state and national level jobs and their updates.