SSC CGL PIE Chart Questions with Detailed Solutions
Get SSC CGL PIE Chart Questions to prepare for your upcoming exam. Solve the most expected questions and detailed solutions that can be asked in the exam.
Important SSC CGL PIE Chart Questions
Q1.
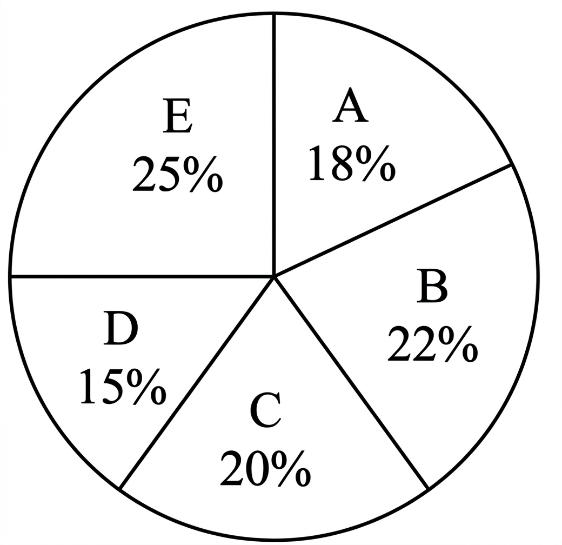
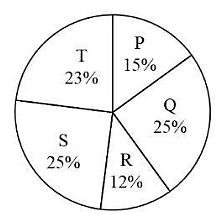
The pie chart given below shows the number of students in the 5 schools. The data is presented in the terms of percent. Total number of students in the given 5 schools = 30000.
Total number of students in which of the following combination of schools are 12600?
A.
B and C
✓ Correct
B.
A and B
C.
C and D
D.
B and e
Answer & Solution
Correct option is A
Given: Total number of students in all 5 schools = 30000 A = 18%, B = 22%, C = 20%, D = 15%, E = 25% Formula Used: Number of students = (Percentage / 100) × Total students Solution: Required number of students = 12600 Corresponding percentage = (12600 / 30000) × 100 = 42% B + C = 22% + 20% = 42% 42% of 30000 = (42 / 100) × 30000 = 12600 Therefore, the required combination of schools is B and C.
Q2.
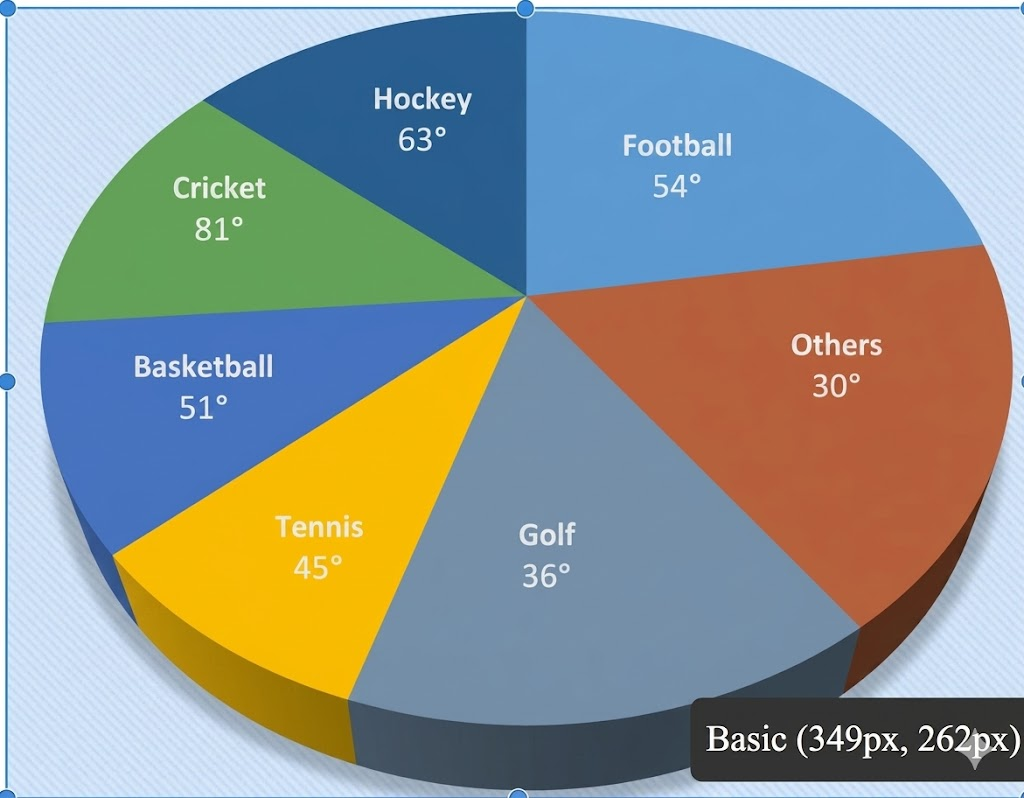
The pie chart given here shows the expenditure of a country on various sports during a particular year. Study the graph carefully and answer the questions given below it.
If the total amount spent on sports during the year is Rs. 10,80,000, the amount spent on cricket exceeds the amount spent on basketball by:
A.
Rs. 93,000
B.
Rs. 90,000
✓ Correct
C.
Rs. 85,000
D.
Rs. 83,000
Answer & Solution
Correct option is B
Given: Total expenditure = 10,80,000 Rs From the standard sports pie chart logic: Central angle for Cricket = 81° Central angle for Basketball = 51° Formula Used: Amount =360Central Angle Difference×Total Expenditure Solution: Find the difference in central angles between Cricket and Basketball: Difference = 81 - 51 = 30° Calculate the excess amount spent using this angular difference out of the total 360 degrees: Excess Amount =36030×1080000
Excess Amount = 121×1080000 Excess Amount = 90000 Rs Final Answer So the correct answer is (b)
Q3.
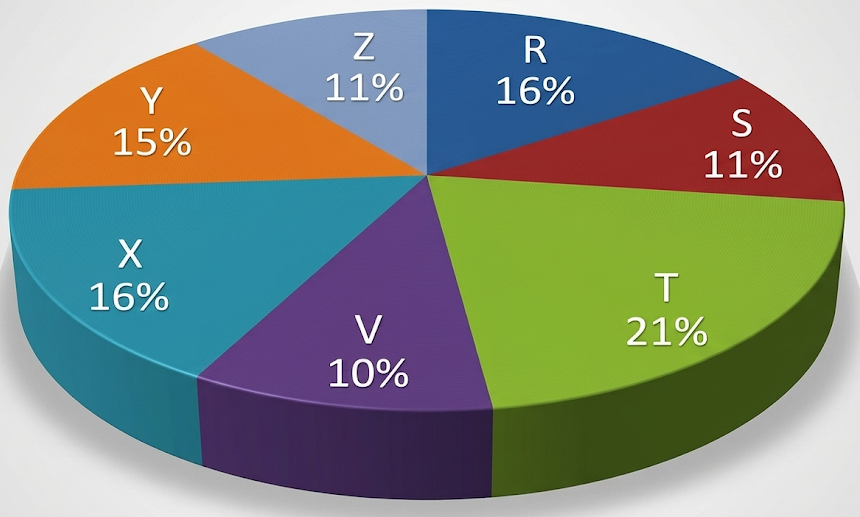
Study the following pie chart and the table and answer the questions based on them. Proportion of Population of Seven Villages in 2002
Village
% Population Below Poverty Line
X
38
Y
52
Z
42
R
51
S
49
T
46
V
58
Find the population of village V if the population of village R living below the poverty line in 2002 is 11220.
A.
12750
B.
13750
✓ Correct
C.
13000
D.
12000
Answer & Solution
Correct option is B
Given: Population of village R below poverty line = 11220 Percentage of population below poverty line in village R = 51% From the pie chart distribution, the proportion of village R is 16% and village V is 10%. Formula Used: Total Population of R = PercentageBelowPovertyPopulation × 100 Population of V = ProportionofRProportionofV × Population of R Solution: Total population of village R = 5111220 × 100 Total population of village R = 220 × 100 = 22000 The ratio of total populations of R and V is 16:10 (or 8:5). Population of village V =1610 × 22000 = 13750. Final Answer So the correct answer is (b)
Q4.
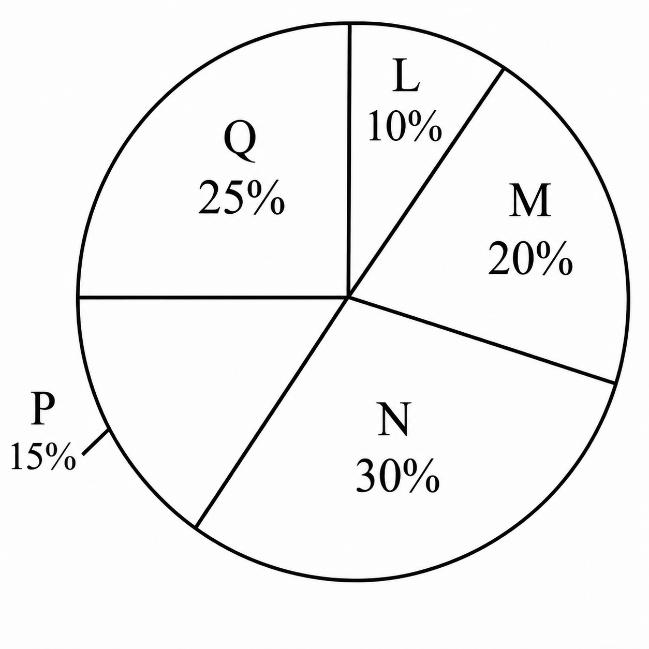
The pie chart given below shows the number of banks in 5 cities. The data is presented in the terms of percent. Difference between the total number of banks in N and Q and total number of banks in L and M = 2500.
What is the ratio of number of banks in N to the total number of banks in P and Q?
A.
3 : 4
✓ Correct
B.
2 : 3
C.
1 : 2
D.
1 : 3
Answer & Solution
Correct option is A
Given: A pie chart representing the percentage of banks in 5 cities. Difference between total banks in N = 30%, P = 15%, Q = 25%
Formula Used: Ratio = ValueofP+ValueofQValueofN Solution: Since the required ratio is between values from the same pie chart, we can directly use their percentage values. According to the data from the chart, the values form the ratio: Ratio = 15+2530=4030=43 Using the respective percentages, the ratio simplifies directly to 3 : 4. Final Answer So the correct answer is (a)
Q5.
The pie chart given below shows the production of wheat by 5 factories. The data is presented in the terms of percent.
What is the ratio of production of wheat by P to the total production of wheat by Q and S?
A.
2 : 7
B.
3 : 10
✓ Correct
C.
5 : 11
D.
6 : 11
Answer & Solution
Correct option is B
Given Production of wheat by P = 15% (deduced from original data) Total production of wheat by Q and S = 50% (deduced from original data) Formula Used Ratio = P / (Q + S) Solution Using the percentage values: Ratio = 5015=103 So the correct answer is (b).
Q6.
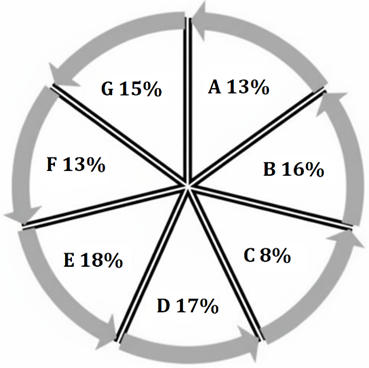
The population of 7 villages is shown in the following pie chart.
If the total population of all the villages is 60000, what is the population of village G?
A.
9000
✓ Correct
B.
8000
C.
11000
D.
10000
Answer & Solution
Correct option is A
Given: Total population = 60000 Village G = 15% Formula Used: Population of G=Total Population×(100Percentage) Solution: Population of G = 60000 × (10015) = 60000 × 0.15 = 9000
Q7.
In a Data Interpretation pie chart, if a particular data category accounts for exactly p% of the total value, which of the following formulas correctly calculates its corresponding central sector angle θ in degrees?
A.
θ=p×3.6∘
✓ Correct
B.
θ=3.6∘p
C.
θ=p×1.8∘
D.
θ=360∘p×100
Answer & Solution
Correct option is A
Given A data category accounts for exactly p% of the total value in a given pie chart. Formula Used Central Angle θ=Total ValueValue of component×360∘ Solution A complete pie chart always represents 100% of the statistical data and a full circle of 360∘. The fraction of the whole for this specific data category is mathematically 100p. To successfully find the corresponding central angle \theta in degrees, we simply multiply this fraction by the total angle (360∘): θ=100p×360∘θ=p×100360∘θ=p×3.6∘ This final formula correctly calculates the central sector angle. Final Answer So the correct answer is (a)
Q8.
A pie chart represents the production volume of 5 companies. The sector angle corresponding to Company X is strictly equal to the interior angle of a regular polygon with 15 sides. What percentage of the total production does Company X account for?
A.
41.66%
B.
43.33%
✓ Correct
C.
45.33%
D.
48.66%
Answer & Solution
Correct option is B
Given Sector angle for Company X = Interior angle of a regular polygon with 15 sides Total angle in a pie chart = 360°
Formula Used Interior angle of a regular n-sided polygon = n(n−2)×180∘ Percentage = 360∘Sector Angle×100 Solution Number of sides of the polygon, n = 15 Calculate the interior angle: Interior angle = 15(15−2)×180∘
Interior angle = 1513×180∘ Interior angle = 13×12∘=156∘ The sector angle for Company X is 156∘ To find the percentage contribution to total production: Percentage = 360156×100
Percentage = 3013×100
Percentage =3130
Percentage = 43.33% Final Answer So the correct answer is (b)
Q9.
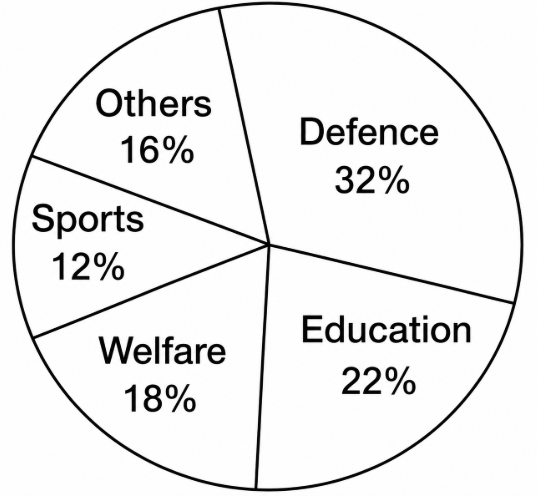
Given below is the pie chart of the expenditure in the year 2020.
Which of the following statements are correct?
A. The central angle for Defence is 115.2°. B. The central angle for Welfare is 64.8°. C. The difference between the central angle for Education and Sports is 36°. D. The sum of the central angle for Education and Welfare is 144°. E. The central angle for Others is 60°. Choose the correct answer from the options given below :
In a pie graph, wheat is 35%, rice is 30%, sugarcane is 20%, gram is 8% and pulses is 7%. A. Wheat area subtends an angle of 126°. B. Rice area subtends an angle of 108°. C. Sugarcane area subtends an angle of 72°. D. Gram area subtends an angle of 25°. Choose the correct answer from the options given below.
A.
A, B and C only
✓ Correct
B.
B, C, D, A
C.
C, D and A only
D.
D, A and B only
Answer & Solution
Correct option is A
Given: Pie graph: wheat 35%, rice 30%, sugarcane 20%, gram 8%, pulses 7%. Statements A–D about angles subtended at the centre. Formula Used: Angle subtended = Percentage×100360°=Percentage×3.6° Solution: A: Wheat = 35×3.6=126° ✓. B: Rice = 30×3.6=108° ✓. C: Sugarcane = 20×3.6=72° ✓. D: Gram = 8×3.6=28.8° ≈ 29°, not 25° ✗. Statements A, B, and C are correct; D is incorrect. Final Answer So the correct answer is (a)
Q11.
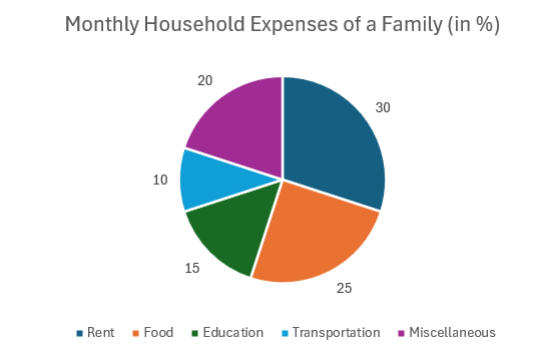
The pie chart shows the percentage-wise distribution of a family’s monthly household expenses. If the family’s total monthly income is ₹40,000, and they spend all of it, how much is spent on Rent?
A.
₹15,000
B.
₹12,000
✓ Correct
C.
₹8,000
D.
₹10,000
Answer & Solution
Correct option is B
Given: Total monthly income = 40000 According to the pie chart data for the answer, the percentage allocated to Rent is 30%. Formula Used: Amount spent = 100Percentage × Total Income Solution: Amount spent on rent = 10030 × 40000 = 30 × 400 = 12000 Final Answer So the correct answer is (b)
Q12.
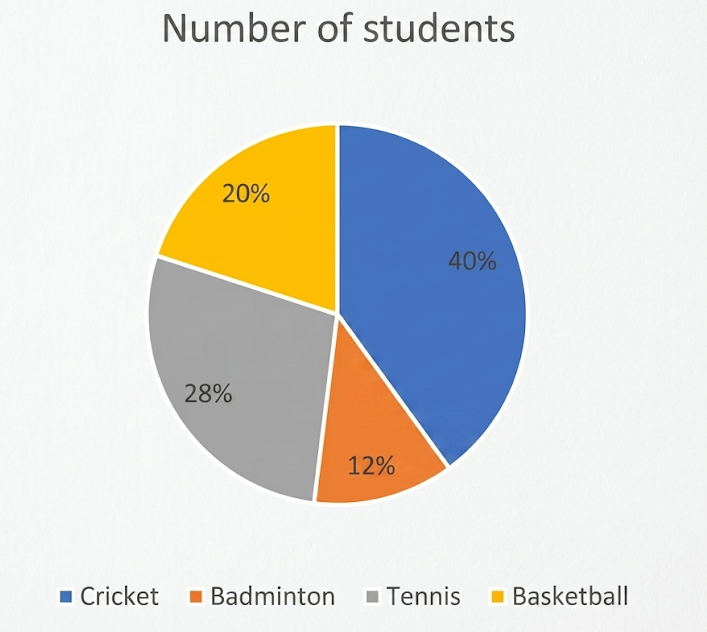
There are 75 students in the class. The following pie chart shows the distribution of students based on their preferred sports. How many students like tennis?
A.
30
B.
21
✓ Correct
C.
25
D.
15
Answer & Solution
Correct option is B
Given: Total number of students = 75. Based on the pie chart, the percentage of students who prefer tennis is 28%. Formula Used: Number of students = 100Percentage × Total Students Solution: Number of students who like tennis = 10028 × 75 = 28 × 43 = 7 × 3 = 21 Final Answer So the correct answer is (b)
Q13.
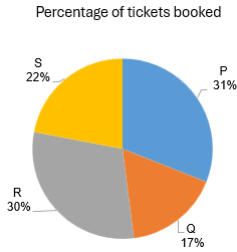
The following pie chart shows the percentage of tickets that were booked for four buses P, Q, R, S on Wednesday. The total number of tickets booked for these four buses together was 200. Find the number of tickets booked for the buses P and S together on Wednesday.
A.
106
✓ Correct
B.
78
C.
150
D.
55
Answer & Solution
Correct option is A
Given: Total number of tickets booked = 200 A pie chart showing percentage distributions for buses P, Q, R, and S. Solution: From the given pie chart, the sum of the percentage of tickets for buses P and S is 53%. Number of tickets booked for buses P and S together = 10053 × 200 Number of tickets booked = 106 Final Answer So the correct answer is (a)
Q14.
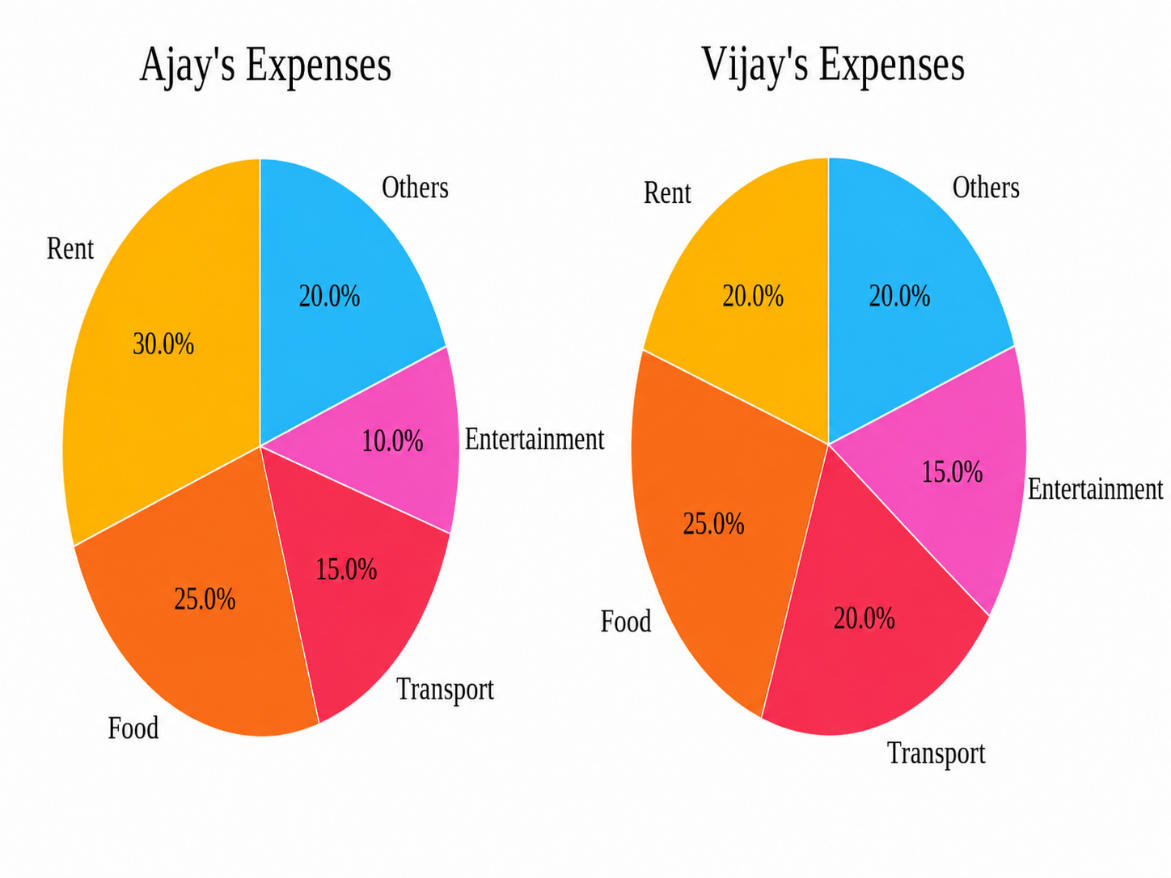
The two pie charts below show the expenditure breakdown of two friends, Ajay and Vijay, for one month. If Ajay spends ₹6,000 on Rent and Vijay spends ₹4,500 on Food, then what is the total monthly expenditure of both?
A.
₹22,000
B.
₹18,000
C.
₹20,000
D.
₹38,000
✓ Correct
Answer & Solution
Correct option is D
Given: Ajay's expenditure on Rent = 6000 Vijay's expenditure on Food = 4500 Formula Used: Total = 100PercentageValue Solution: Ajay expense on rent 6000
So, 30% of total expense = 6000
Total expense = 306000×100 = 20,000
Vijay food expense = 4500
Vijay total expense =254500×100 = 18000
Total monthly expenditure of Ajay and Vijay = 20000 + 18000 = 38000
Final Answer So the correct answer is (d)
Q15.
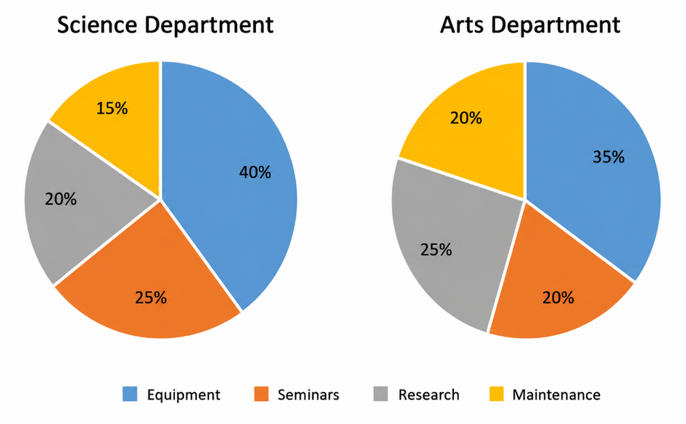
The two pie charts given below represent the percentage-wise budget allocation of the Science and Arts departments. The annual budget of the Science Department is ₹5 lakh, and that of the Arts Department is ₹4 lakh. Which department spends more on seminars, and by how much?
A.
Arts Department, by ₹10000
B.
Science Department, by ₹45000
✓ Correct
C.
Science Department, by ₹125000
D.
Arts Department, by ₹45000
Answer & Solution
Correct option is B
Given: Science Department annual budget = 500000 Arts Department annual budget = 400000 Formula Used: Expenditure = Total Budget × 100Percentage Solution: Expenditure on seminar by Science department = 10025×500000=125000
Expenditure on seminar by Arts department = 10020×400000=80000
By comparing Science > Arts
(Science department spend more by) = 125000 - 80000 = 45000 Final Answer So the correct answer is (b)