Correct option is B
Step-by-step Reasoning:
To assess species diversity, we consider:
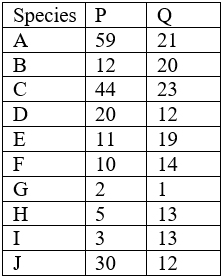
Species richness (number of different species) – both P and Q have 10 species → equal richness
Evenness – how individuals are distributed across species
Visual Pattern from the Table:
In Community P, some species dominate:
In Community Q, distribution is more even:
Let’s compute Simpson’s Diversity Index (D) for both, which is commonly used:
D=1−∑(N(N−1)ni(ni−1))
For Community P:Total NP=196∑ni(ni−1)P=59(58)+12(11)+44(43)+20(19)+11(10)+10(9)+2(1)+5(4)+3(2)+30(29)=3422+132+1892+380+110+90+2+20+6+870=6924
DP=1−196(195)6924=1−382206924≈1−0.1812=0.8188
For Community Q:Total NQ=148∑ni(ni−1)Q=21(20)+20(19)+23(22)+12(11)+19(18)+14(13)+1(0)+13(12)+13(12)+12(11)=420+380+506+132+342+182+0+156+156+132=2406
DQ=1−148(147)2406=1−217562406≈1−0.1106=0.8894
Conclusion:
Correct Answer: 2. Community Q has higher species diversity than P
Information Booster:
Simpson's Diversity Index gives higher value for evenly distributed species.
Both communities have the same species richness (10 species), but evenness differs.
Diversity is a function of both richness and evenness.