Correct option is B
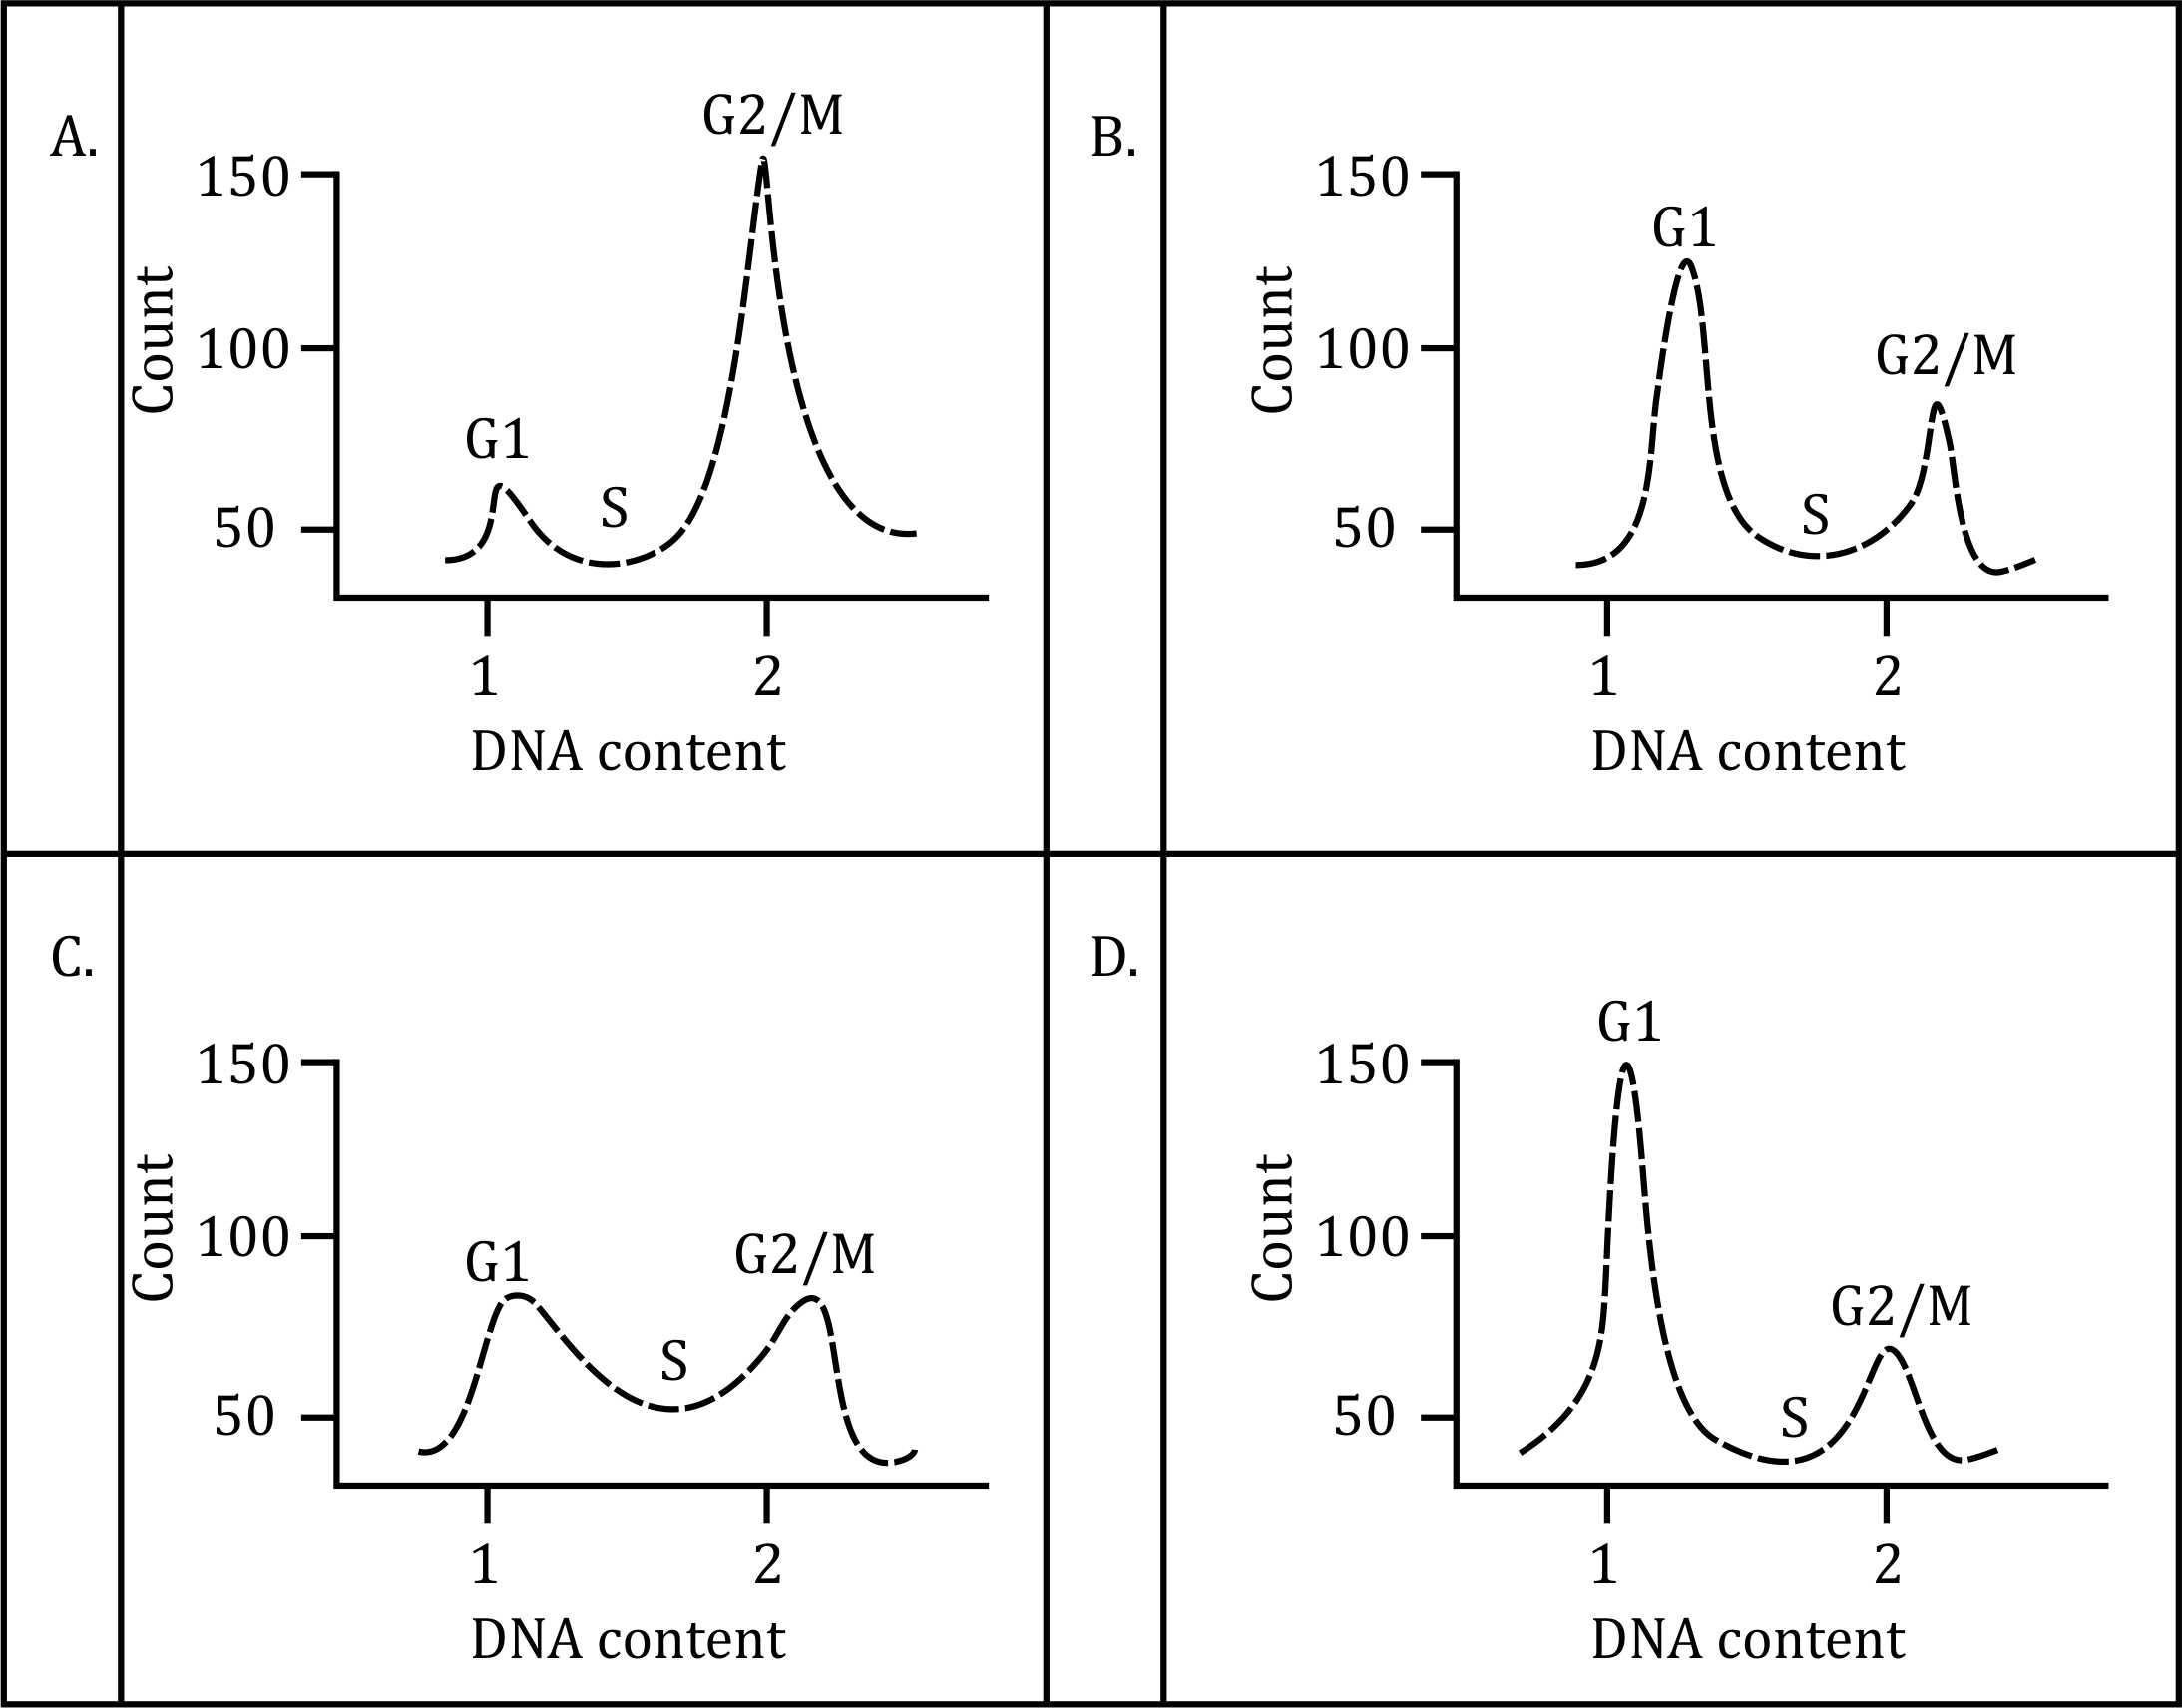
Step 1: Understanding the Flow Cytometry Plots
- G1 Phase (Low DNA content, Peak at 1 unit DNA content)
- Indicates cells are arrested before DNA replication.
- S Phase (Intermediate DNA content)
- Represents cells actively replicating DNA.
- G2/M Phase (High DNA content, Peak at 2 units DNA content)
- Indicates cells preparing for mitosis or undergoing division.
Step 2: Identifying the Control Group (MCF7 - Buffer Treated)
- MCF7 is the control group, meaning its cell cycle profile should show a normal distribution of G1, S, and G2/M phases.
- Graph C represents a normal cell cycle pattern.
- Thus, MCF7 corresponds to Graph C.
Step 3: Effect of Cyclin D Inhibition (MCF7.1)
- Cyclin D promotes the transition from G1 to S phase.
- Inhibiting Cyclin D should cause G1 arrest, meaning most cells accumulate in G1 with a reduction in S-phase and G2/M cells.
- Graph A shows a strong G1 arrest, which matches this expectation.
- Thus, MCF7.1 corresponds to Graph A.
Step 4: Effect of Cyclin B1 Knockdown (MCF7.2)
- Cyclin B1 is essential for the G2/M transition.
- Inhibiting Cyclin B1 should cause G2/M arrest, meaning cells accumulate at G2/M with fewer in G1 and S phase.
- Graph D shows a G2/M block, meaning cells are arrested in the G2/M phase.
- Thus, MCF7.2 corresponds to Graph D.