hamburger menu
All Coursesall course arrow
adda247
reward-icon
adda247
    arrow
    arrow
    arrow
    ​Protein X is an all helical protein with 100 amino acids including 2 cysteines and a pI of 7.0. Which one of the following graphs best describes the
    Question

    Protein X is an all helical protein with 100 amino acids including 2 cysteines and a pI of 7.0. Which one of the following graphs best describes the solubility of this protein under different ammonium sulphate (salt) concentrations?

    A.

    B.

    C.

    D.

    Correct option is B

    Explanation-

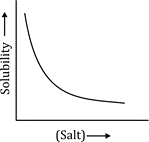
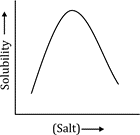
    Low salt → increases solubility (salting-in)
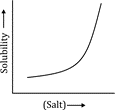
    High salt → decreases solubility (salting-out)

    First salting-in, then salting-out.
    Resulting curve: first rises, then falls → bell-shaped, as in Option b
    pH = pI = 7.0
    The protein has no net charge, hence it's least soluble at pI. Salting-in effect is limited around pI but still occurs with low salt. Eventually, at very high salt, water is stripped, and protein precipitates (salting-out).

    Final answer : Option b 


    Similar Questions

    test-prime-package

    Access ‘CSIR NET Life Sciences’ Mock Tests with

    • 60000+ Mocks and Previous Year Papers
    • Unlimited Re-Attempts
    • Personalised Report Card
    • 500% Refund on Final Selection
    • Largest Community
    students-icon
    398k+ students have already unlocked exclusive benefits with Test Prime!
    Our Plans
    Monthsup-arrow