Correct option is C
The diversity of ecological communities is often measured using multiple indices and tools to capture both species richness and evenness. The
Shannon-Weaver Diversity Index quantifies the diversity of a community by considering the number of species (richness) and their relative abundance (evenness).
Rank-Abundance Diagrams (RADs) visually represent the relative abundance of species in a community, showing their rank and proportional contribution to the community.
Shannon-Weaver Diversity Index: Formula:
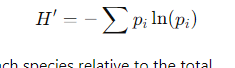
where pi is the proportion of each species relative to the total.
It provides a numerical value for community diversity, accounting for both species richness and evenness.
Rank-Abundance Diagrams: These are graphical tools that plot species rank (most abundant to least abundant) against their relative abundance. RADs are useful for comparing community structure and understanding dominance patterns.
Since both methods provide complementary information—Shannon-Weaver offers a quantitative measure, while RADs offer visual insights—
both are needed to comprehensively compare community diversity.
Information Booster: 1. Shannon-Weaver Diversity Index:
· Reflects both species richness and evenness.
· High H indicates high diversity.
2. Rank-Abundance Diagrams:
· Help visualize species distribution patterns.
· Steep slopes indicate dominance by few species, while flat slopes show even distribution.
3. Importance Value Index (IVI):
· A composite measure incorporating relative density, frequency, and dominance.
· Useful for vegetation studies but limited in broader diversity comparisons.
4. Species Evenness and Richness:
· Evenness measures how evenly individuals are distributed among species.
· Richness counts the total number of species.
5. Applications:
· Biodiversity conservation planning.
· Ecosystem health assessments.
 English
 10 Questions
 20 Marks
 12 Mins