Correct option is D
The correct answer is: (4)
Explanation:
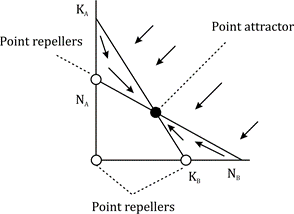
In classical Lotka-Volterra competition models, the interaction between two species is analyzed using isocline diagrams, where each species' zero-growth isocline defines the conditions under which its population remains stable.
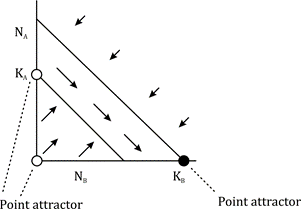
In Graph 4, the isoclines of both species intersect, and the vector field shows arrows pointing towards the intersection point from various directions. This indicates that regardless of the initial population sizes of both species A and B, the system moves towards a stable equilibrium point—an attractor. This intersection point lies between the carrying capacitiesKAK_A KA and KBK_BKB, and it is stable, suggesting coexistence.
Thus, Graph 4 shows the scenario where both species are expected to coexist stably over an extended period.
Information Booster:
Graph 4 represents the stable coexistence of two competing species.
The isoclines intersect, and the direction of the arrows indicates movement towards the equilibrium point.
Coexistence is feasible when intraspecific competition (within species) is more intense than interspecific competition (between species).
The intersection point acts as a stable attractor.
This outcome is a classic prediction of the Lotka-Volterra competition model.
Stable coexistence implies that small perturbations will still result in return to equilibrium.
This model helps ecologists understand how species sharing similar resources can stably coexist through niche differentiation.
Additional Information:
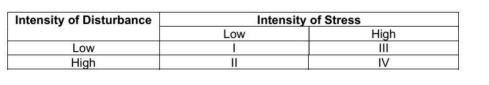
Graph 1: Shows a scenario where species B outcompetes species A, and the system stabilizes with only species B.
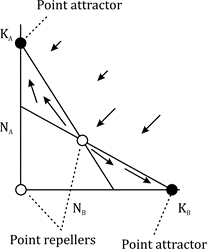
Graph 2: Represents unstable coexistence, where the outcome depends on initial conditions—either species A or B dominates based on who starts closer to its carrying capacity.
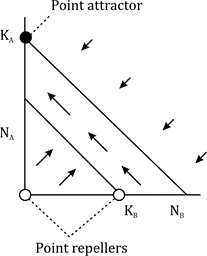
Graph 3: Suggests that species A outcompetes species B, with stable equilibrium only at species A's carrying capacity.