Correct option is C
The logistic growth equation describes how populations grow in a restricted environment, taking into account environmental carrying capacity (K). The equation for logistic growth is:
Where:
NNN is the population size,
rrr is the growth rate,
KKK is the carrying capacity.
The logistic growth curve is characterized by three main phases:
Initial phase: Rapid growth when the population is small and resources are abundant (exponential growth).
Deceleration phase: As the population approaches the carrying capacity, growth slows due to limited resources.
Equilibrium phase: The population stabilizes as it reaches the carrying capacity.
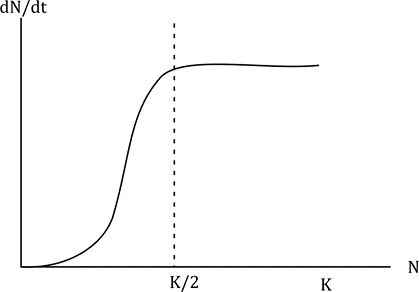
In the plot (3), the curve shows the classic logistic growth pattern:
At low population sizes (N), the growth rate increases rapidly.
At medium population sizes, the growth rate starts to slow down.
As the population approaches the carrying capacity (K), the growth rate becomes very small and stabilizes, reflecting the equilibrium phase.
Information Booster:
Logistic growth curve: The logistic growth curve initially resembles exponential growth, but it eventually levels off as environmental resistance (like limited resources) slows population growth. This leveling off occurs when the population approaches the carrying capacity, where the growth rate equals zero.
Carrying Capacity (K): The carrying capacity is the maximum population size that an environment can support, considering the availability of resources like food, space, and other essentials. At this point, the growth rate of the population declines, and the population stabilizes.
Exponential Growth: In the early stages of logistic growth, the population grows exponentially. This occurs before environmental resistance significantly limits growth.
Additional Information:
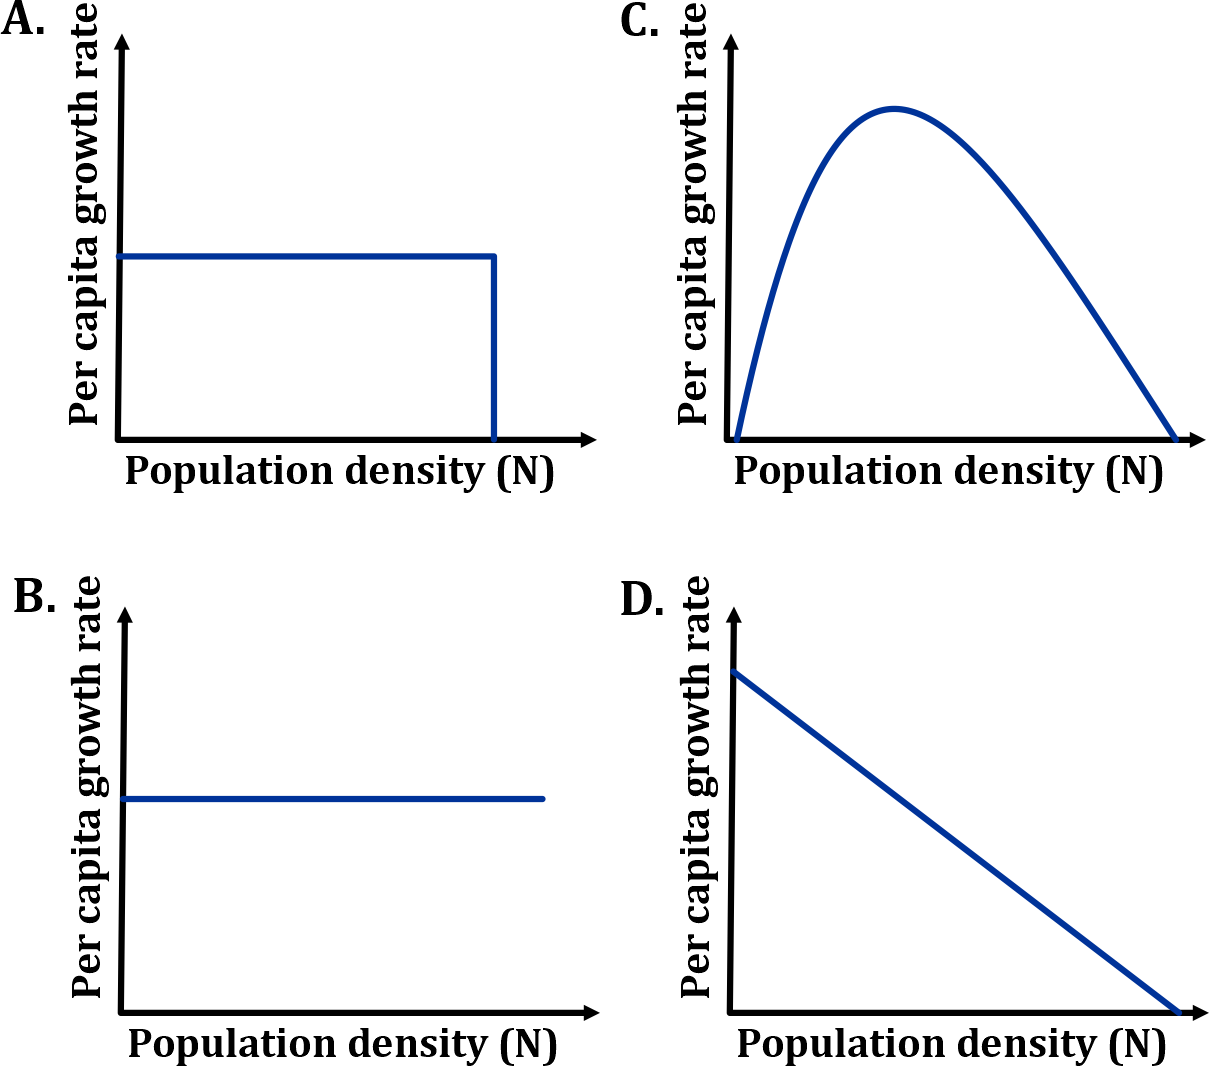
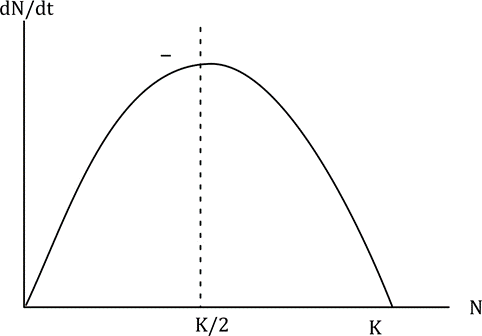
Option (1): This curve does not follow the logistic equation as it shows rapid growth initially but never decelerates to a stable equilibrium. This is more characteristic of exponential growth.
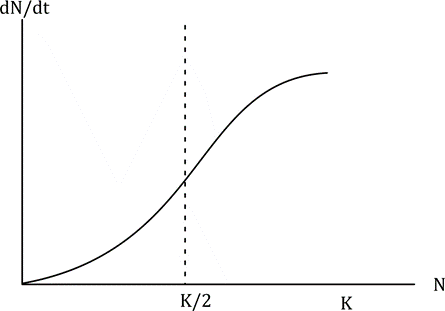
Option (2): The plot depicts a continuous increase in growth, but does not reflect the deceleration phase that is characteristic of logistic growth before reaching equilibrium.
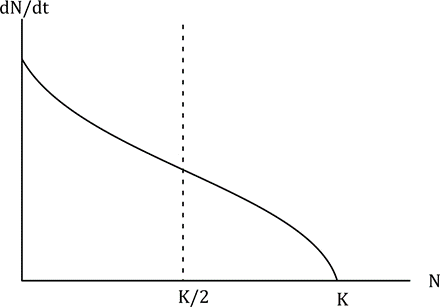
Option (4): This curve depicts a decreasing population, which does not correspond to the logistic growth model, where population growth initially increases and then slows down, not decreases.