arrow
arrow
arrow
​The graph below shows the change in the size of four populations (A-D) over time.​​Which among the four populations (A, B, C, and D) would have the l
Question

The graph below shows the change in the size of four populations (A-D) over time.

Which among the four populations (A, B, C, and D) would have the lowest intrinsic rate of population growth (r)?

A.

A

B.

B

C.

C

D.

D

Correct option is D

Explanation-

Intrinsic rate of increase (r) represents the rate at which a population increases in size under ideal conditions (i.e., maximum reproductive capacity). A higher slope on the population vs. time graph indicates a higher intrinsic growth rate. A declining population indicates a negative r, meaning more deaths than births.
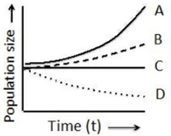
Understanding  the graph:
Population A (Curve A) : Steep upward curve → highest growth rate (r is high)
Population B (Curve B) : Moderate upward curve → moderate r
Population C (Curve C) : Flat line → no growth → r = 0
Population D (Curve D) : Declining curve → decreasing population → r is negative (lowest)

Correct Answer:  Option d - D
Population D shows a decline in population size over time, indicating the lowest intrinsic rate of growth (r)—likely a negative value. Hence, it has the lowest growth rate among the four.

Similar Questions

test-prime-package

Access ‘CSIR NET Life Sciences’ Mock Tests with

  • 60000+ Mocks and Previous Year Papers
  • Unlimited Re-Attempts
  • Personalised Report Card
  • 500% Refund on Final Selection
  • Largest Community
students-icon
353k+ students have already unlocked exclusive benefits with Test Prime!
Our Plans
Monthsup-arrow