Correct option is A
Explanation-
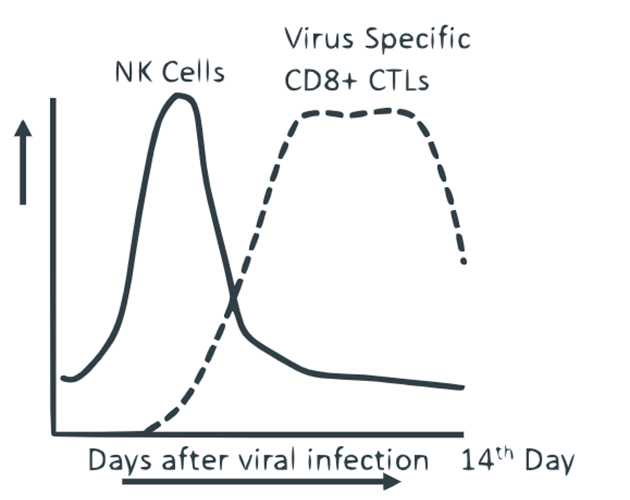
During a typical acute viral infection, the kinetics of immune cell response are:
1. NK Cells (Natural Killer Cells)
(i) Part of innate immunity
(ii) Respond very early (within hours to 1–2 days)
(iii) Peak quickly, then decline
Function: recognize infected cells with reduced MHC I and kill them
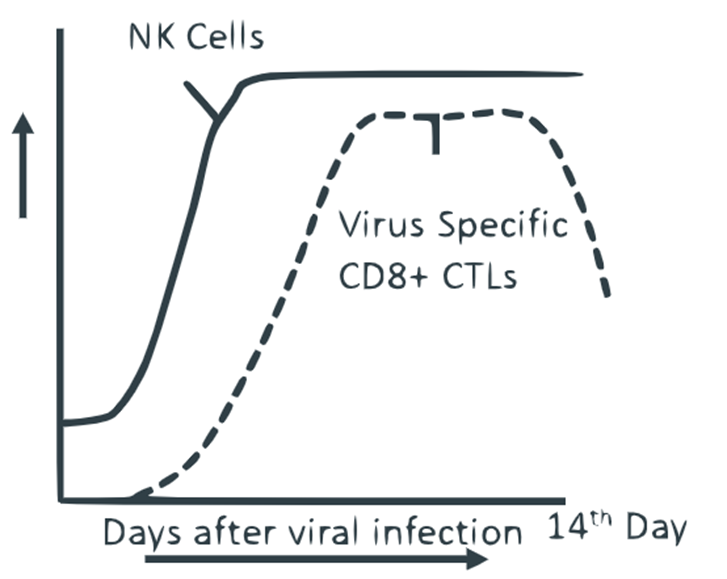
So, in the correct graph, NK cell numbers rise early and drop off before day 14.
2. CD8⁺ CTLs (Cytotoxic T Lymphocytes)
(i) Part of adaptive immunity
(ii) Require antigen presentation → activation → clonal expansion
(iii) Rise later (around day 3–4), peak around day 7–10
Decline after virus is cleared (day 14)
So, CD8⁺ CTLs rise later than NK, peak around day 10, and then decline.
Graph in Option a shows:
(i) Solid line (NK cells) rises early, peaks, and declines before day 14
(ii) Dotted line (CD8⁺ CTLs) rises later, peaks near day 10, and then declines
This matches immunological response pattern.
Incorrect Options -
Option b: CTLs plateau too early and stay high – unrealistic.
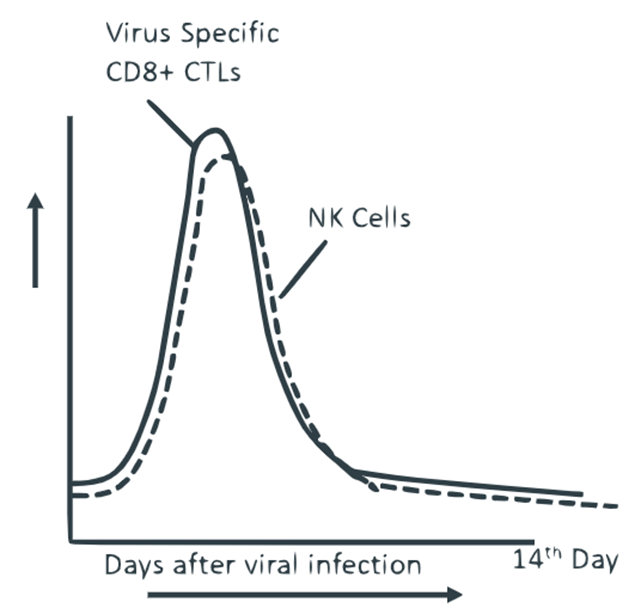
Option c: Shows CTLs peaking before NKs – wrong sequence.
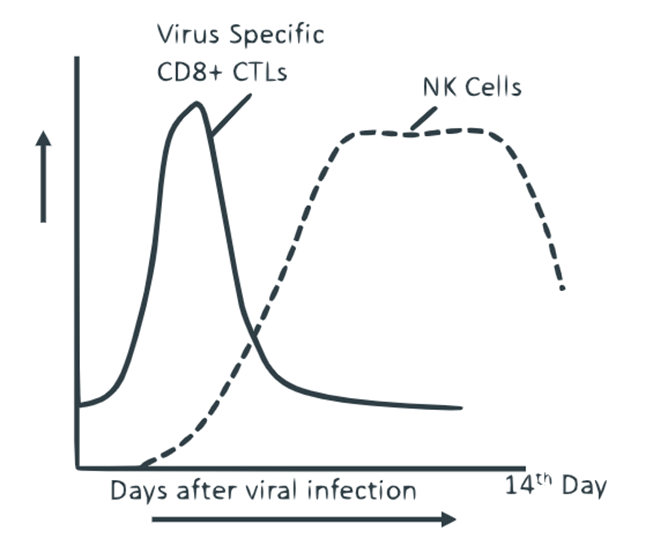
Option d: NKs rise after CTLs – again, biologically incorrect.
Final Answer: Option a is correct.