arrow
arrow
arrow
The pie-chart shows the data of sales (in percentage) of a company in four quarters. Study the given pie-chart and answer the question that follows.If
Question

The pie-chart shows the data of sales (in percentage) of a company in four quarters. Study the given pie-chart and answer the question that follows.

If the total production in a year is 4200 units, then the difference in sales in the 2nd and 4th quarters is (in units):

A.

180

B.

190

C.

200

D.

210

Correct option is D

Given:

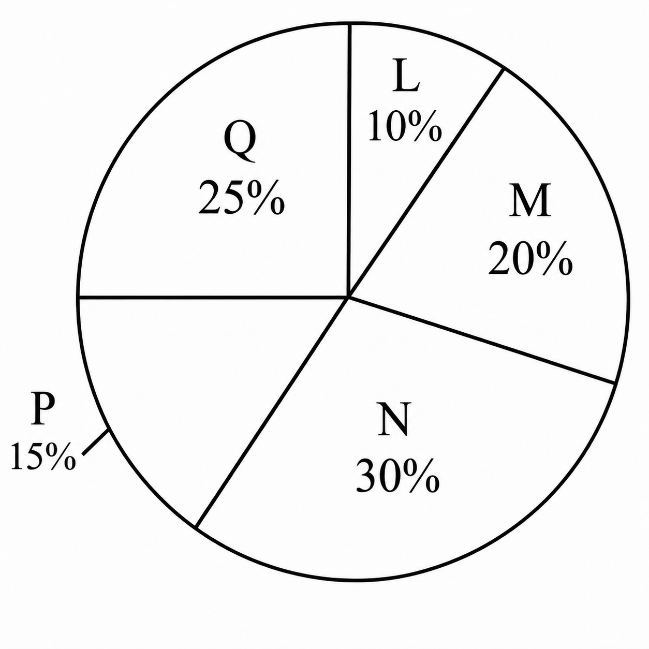
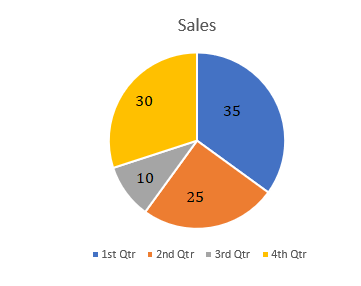
Total production in a year = 4200 units

Sales in 2nd Quarter = 25%

Sales in 4th Quarter = 30%

Formula Used:

The sales for each quarter are calculated as:

Sales=(Percentage share100)×Total production\text{Sales} = \left( \frac{\text{Percentage share}}{100} \right) \times \text{Total production}

Solution:

Sales in 2nd Quarter: 25100×4200=1050 units\frac{25}{100} \times 4200 = 1050 \text{ units}

Sales in 4th Quarter:30100×4200=1260 units\frac{30}{100} \times 4200 = 1260 \text{ units}

Difference: 1260 − 1050 = 210 units

Thus, option (d) is right answer.

Free Tests

Free
Must Attempt

CBT-1 Full Mock Test 1

languageIcon English
  • pdpQsnIcon100 Questions
  • pdpsheetsIcon100 Marks
  • timerIcon90 Mins
languageIcon English
Free
Must Attempt

RRB NTPC Graduate Level PYP (Held on 5 Jun 2025 S1)

languageIcon English
  • pdpQsnIcon100 Questions
  • pdpsheetsIcon100 Marks
  • timerIcon90 Mins
languageIcon English
Free
Must Attempt

CBT-1 General Awareness Section Test 1

languageIcon English
  • pdpQsnIcon40 Questions
  • pdpsheetsIcon30 Marks
  • timerIcon25 Mins
languageIcon English

Similar Questions

test-prime-package

Access ‘RPF Sub Inspector’ Mock Tests with

  • 60000+ Mocks and Previous Year Papers
  • Unlimited Re-Attempts
  • Personalised Report Card
  • 500% Refund on Final Selection
  • Largest Community
students-icon
353k+ students have already unlocked exclusive benefits with Test Prime!
Our Plans
Monthsup-arrow