Correct option is C
Explanation-
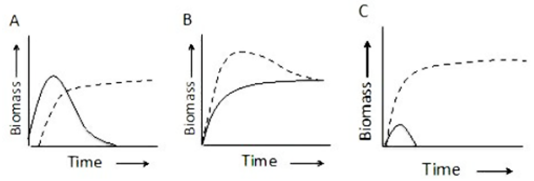
Graph A: One species (solid line) increases in biomass early, then declines. Another species (dashed line) rises after that and persists.
This is a replacement or stepwise dominance over time. This is Sequential Succession (iii)
→ One species is succeeded by another.
Graph B: Both species coexist for a long time. Their biomass levels stabilize, suggesting that their community composition becomes similar.
This is Convergence (ii)
→ Over time, different species might stabilize together.
Graph C: One species (solid line) begins to grow but then gets eliminated completely. The other species (dashed line) continues to rise and dominate.
This is Total Suppression (i)
→ One species completely suppresses the other.
Final Matching:
A – (iii) Sequential Succession
B – (ii) Convergence
C – (i) Total Suppression
This matches the answer: Option c
A - (iii), B - (ii), C - (i)