arrow
arrow
arrow
The given bar chart shows production of cars by different manufacturers from year 2001 to 2004. All values are in thousands. What was the total prod
Question

The given bar chart shows production of cars by different manufacturers from year 2001 to 2004. All values are in thousands.
What was the total production of cars in thousands from 2001 to 2004 ?

A.

53500

B.

52500

C.

51000

D.

52000

Correct option is A

Given:

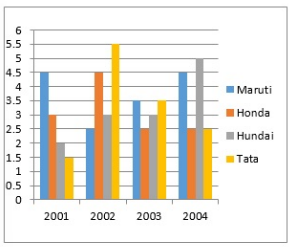
Given chart shows the production of cars by different manufacturers from the year 2001 to 2004

Solution:

Total production of cars in the year 2001 = 4.5 + 3 + 2 + 1.5= 11 thousands

Total production of cars in the year 2002 = 2.5 + 4.5 + 3 + 5.5 =15.5 thousands

Total production of cars in the year 2003 = 3.5 + 2.5 + 3 + 3.5 = 12.5 thousands

Total production of cars in the year 2004 = 4.5 + 2.5 + 5 + 2.5 = 14.5 thousands

So total production of cars from the year 2001 to 2004 is: 11 + 15.5 + 12.5 + 14.5 = 53.5 thousands = 53500

Free Tests

Free
Must Attempt

CBT-1 Full Mock Test 1

languageIcon English
  • pdpQsnIcon100 Questions
  • pdpsheetsIcon100 Marks
  • timerIcon90 Mins
languageIcon English
Free
Must Attempt

RRB NTPC Graduate Level PYP (Held on 5 Jun 2025 S1)

languageIcon English
  • pdpQsnIcon100 Questions
  • pdpsheetsIcon100 Marks
  • timerIcon90 Mins
languageIcon English
Free
Must Attempt

CBT-1 General Awareness Section Test 1

languageIcon English
  • pdpQsnIcon40 Questions
  • pdpsheetsIcon30 Marks
  • timerIcon25 Mins
languageIcon English

Similar Questions

test-prime-package

Access ‘RRB NTPC’ Mock Tests with

  • 60000+ Mocks and Previous Year Papers
  • Unlimited Re-Attempts
  • Personalised Report Card
  • 500% Refund on Final Selection
  • Largest Community
students-icon
353k+ students have already unlocked exclusive benefits with Test Prime!
Our Plans
Monthsup-arrow