arrow
arrow
arrow
The bar graph given below shows the number of cars produced in the given 5 years. R = Average number of cars produced in the given 5 years A = Tot
Question

The bar graph given below shows the number of cars produced in the given 5 years.

R = Average number of cars produced in the given 5 years
A = Total number of cars produced in Y2, Y3 and Y4.
What is the value of A - R?

A.

106.2

B.

128.4

C.

148.8

D.

180.2

Correct option is C

Given:
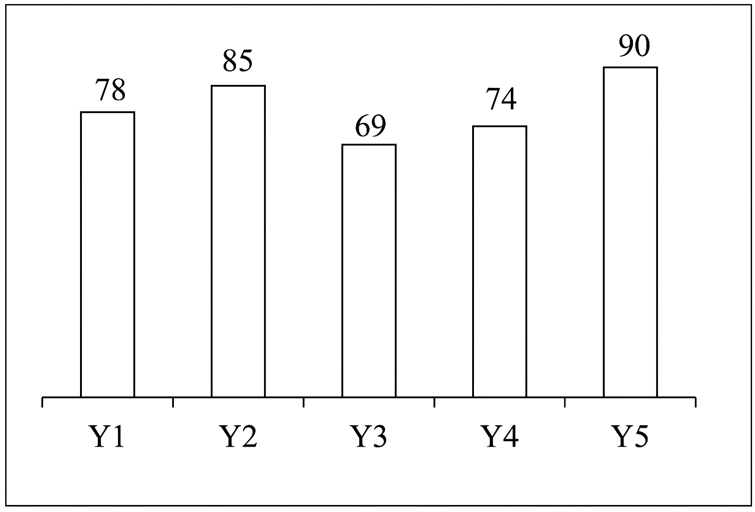
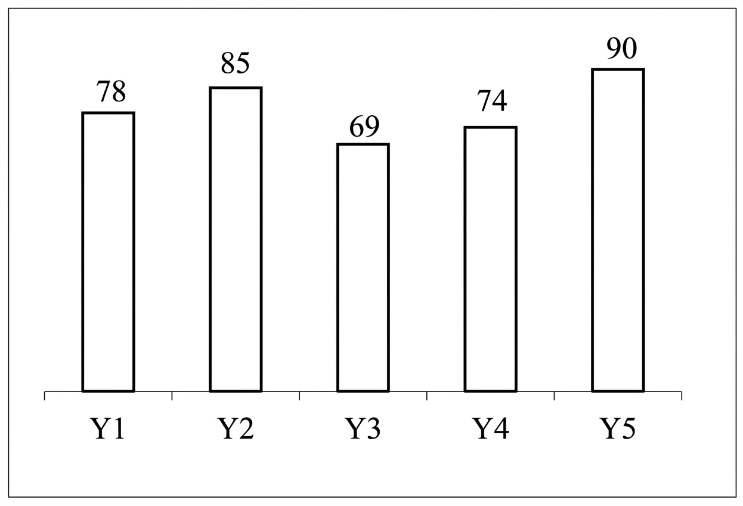
Bar graph data for cars produced across 5 years.
R = Average number of cars produced in all 5 years.
A = Total number of cars produced in Y2, Y3, and Y4.
Formula Used:
Average = Sum of observationsNumber of observations \frac{Sum\ of\ observations}{Number\ of\ observations}​​
Solution:
Average number of cars produced in all 5 years:

R = 78+85+69+74+905\frac{78 + 85 + 69 + 74 + 90 }{5}​ = 79.2
Total number of cars produced in Y2, Y3 and Y4: 

A = 85 + 69 + 74 = 228
Now, 

A - R = 228 - 79.2 = 148.8
Final Answer
So the correct answer is (c)

Free Tests

Free
Must Attempt

SSC GD PYP (Held on 4 Feb 2025 S1)

languageIcon English
  • pdpQsnIcon80 Questions
  • pdpsheetsIcon160 Marks
  • timerIcon60 Mins
languageIcon English
Free
Must Attempt

SSC GD Constable Exam Day Based Mock 1

languageIcon English
  • pdpQsnIcon80 Questions
  • pdpsheetsIcon160 Marks
  • timerIcon60 Mins
languageIcon English
Free
Must Attempt

Mathematics Section Test 1

languageIcon English
  • pdpQsnIcon20 Questions
  • pdpsheetsIcon40 Marks
  • timerIcon25 Mins
languageIcon English

Similar Questions

test-prime-package

Access ‘SSC MTS (Similar PYPs)’ Mock Tests with

  • 60000+ Mocks and Previous Year Papers
  • Unlimited Re-Attempts
  • Personalised Report Card
  • 500% Refund on Final Selection
  • Largest Community
students-icon
444k+ students have already unlocked exclusive benefits with Test Prime!

Similar Questions

Our Plans
Monthsup-arrow